I've been playing around with the linear regression, and I was thought that before commencing it's always good to plot an heatmap to see whether there are features that somehow is worth testing for their significance/relationship. Would you agree with the above?
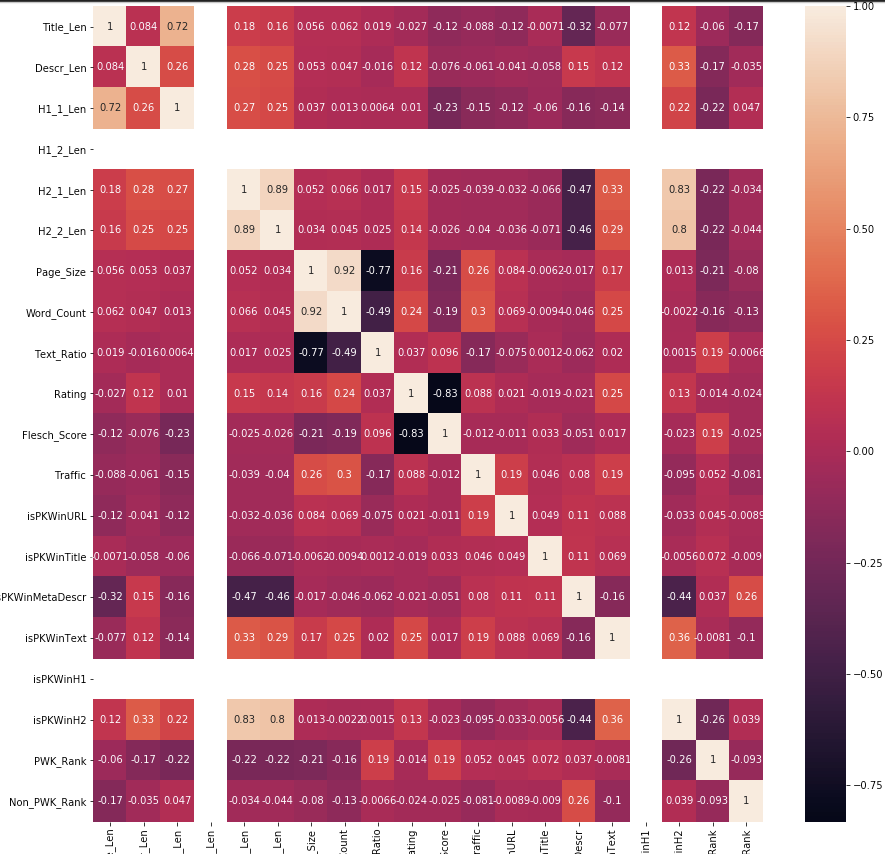
With that being said, after having refined a tiny bit my data, I obtained the following heatmap:
As you can see I now have two features completely blank. I though in the beginning to some sort of rendering glitch, which is not the case.
In reviewing the dataset, I found out that the features have always the same value across the dataset.
I'd assume this is not being printed out due to the fact this feature has became statistically significant for every feature.
Would you say this is a correct way of referring to this? Or is there any other way to express this concept?
This is however not the case for the other feature, which contains a mix of numerical value, hence I'm not able to explain.
Can you please advice?


H1_2_Lenvalues? $\endgroup$