2
$\begingroup$

K-means anomaly detection scatter plot

The following code, takes a single column from a dataset and then adds 50 anomalies to the dataset that is quite bigger than the maximum values of the dataset.

import pandas as pd
import numpy as np
import pandas as pd
from sklearn.cluster import KMeans
import matplotlib.pyplot as plt
import seaborn as sns

X=pd.read_csv('C:/Files/dataset.csv', sep=';', encoding='latin1' )

#Adding the anomalies

for i in range(0, 50):
    X.append(X.my_column.max() * (10 + pd.np.abs(pd.np.random.normal())))
X = pd.np.array(X)

clf = KMeans(n_clusters=2, init='k-means++', max_iter=300, n_init=10, random_state=1)
clf.fit(X.my_column.values.reshape(-1, 1))
X_prd = clf.predict(X.my_column.values.reshape(-1, 1))

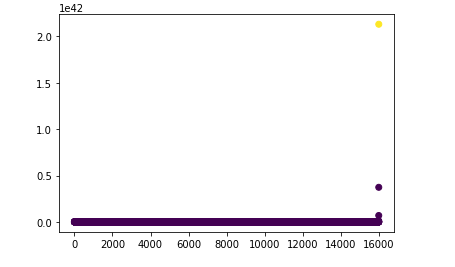
plt.scatter(X.index, X.my_column, c=X_prd)

enter image description here

The picture bellow shows the results and I was expecting outlier cluster to be clear compared the normal data.

Why so ?

Because for creating the anomalies I took the maximum value of my_column which was 9689.

I am stuck here and I don’t know where to do from here, so I would appreciate some help.

The goal is that K mean to detected these added anomalies.

$\endgroup$
0

3 Answers 3

1
$\begingroup$

By multiplying the maximum by 10 in a loop, you are repeatedly multiplying by $\sim 10$, so that the final point is $\sim 10^{53}$ (hrm, the plot actually doesn't go quite that far?). Hence the last added point is so far away from the rest, it becomes too costly to include any other points in that cluster. (Doing so drags the mean of the cluster very far away, and then the cost function blows up; see the sklearn manual.)

$\endgroup$
1
$\begingroup$

I think there's no point in trying to catch all anomalies in one cluster. Anomalies are anomalies because they shouldn't belong to any cluster.

In your case, it's better to cluster with n_clusters=1 and interpret outliers as anomalies. Also, k-means is probably not the best algorithm for your data because distance to centroid will still catch the outlier. Probably, it's better to use DBSCAN or something else, maybe change distance metrics or even write your own distance function.

$\endgroup$
1
$\begingroup$

Your example shows that K-means (and clustering in general) is not a suitable tool to detect anomalies.

Anomalies are, by definition, points (observations) deviating from normality, however that normality is defined. Clusters, on the other hand, are collections of points sharing some similarities.

In your case, you use distance from cluster centroids as the (dis)similarity measure. But, your artificially created "anomalies" are not "similar" in the sense of having similar distances from a hypothetical centroid.

Edit:

If you have no domain knowledge about your "normal" data and the anomalies, it is common to start with an assumed Gaussian distribution. But, in your case, that would be of no help, since your anomalies are all in the same direction and quite diverse in regard to their magnitude.

Instead, you may try computing the median, because it is insensitive to outliers, and use it as the center of the "normal" data. Then you compute the distances between it and all other points and declare those beyond some threshold as outliers.

The concept of median can be generalized to multidimensional data.

$\endgroup$
2
  • $\begingroup$ i was thinking to gplot the centroid and find the furthest value from the centroid, then add the anomalies and if a value is further away from the threshold, it should be labeled as outlier, but unfortunately I'm not sure how to start. Do you have any recommandation ? $\endgroup$
    – E199504
    Commented Mar 11, 2020 at 13:29
  • $\begingroup$ @be1995: See the edit to my answer. $\endgroup$
    – Igor F.
    Commented Mar 11, 2020 at 13:40

Your Answer

By clicking “Post Your Answer”, you agree to our terms of service and acknowledge you have read our privacy policy.

Not the answer you're looking for? Browse other questions tagged or ask your own question.