I'm hoping to get some answers to a question I have regarding normalization of DTW datasets, in particular datasets in which two time-series shapes with similar shapes but differences in magnitude are misclassified under z-normalization.
One reason is simply empirical. When I z-normalize my data it doesn't cluster well. When I don't z-normalize it works quite well. But that isn't really enough to ignore the normalization advice.
The second is in reading the links in this thread which does a good job summarizing the other threads related to this, reading the literature, and thinking about my data. I cannot find a good discussion of the case where magnitude matters within a subset of similar clusters and z-normalization negates that important magnitude difference. In cases where the shape of some data can generally be the same (the lengths are the same, but the amplitude differs) z-normalization makes them cluster as identical when they aren't. Does this mean that DTW just isn't the right tool, that I should be normalizing differently, or is my data a special case because it is already normalized the way it is collected?
Briefly, my data is isotopic ratios recorded in fish "ear stones" which change as a fish moves from one location to another and are recorded in the growing layers of the stone (called an otolith). The isotope ratio in each river is very stable, and that ratio is known to the third or fourth decimal place. There is no biological fractionation, the information is recorded as it exists in the river when the fish enters the river. All data is normalized at collection with regard to the global ocean value which is known to the 5th decimal place. What we care about is classifying the data according to the shape of the isotopic curve, which is characteristic of where and when fish moved between rivers, the different decisions fish make in their movements. All the curves are interpolated to the same length prior to analysis.
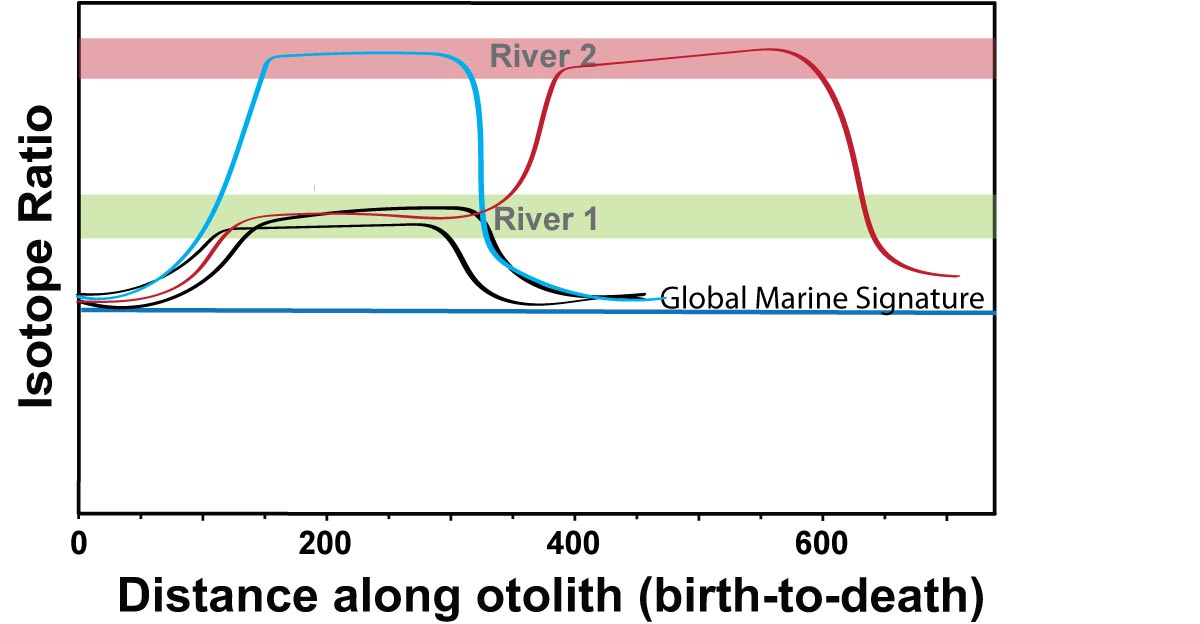
The problem I see in my data is illustrated by the conceptual plot below.
The warping of DTW helps to better classify fish with mild differences in their movement timing, like the two black lines in the plot. It also does a good job of classifying patterns with really different shapes (the red line). Without z-normalization, DTW correctly classifies the blue line as a different group. But, using z-normalization, the two black lines classify with the blue line because the magnitude difference is erased.
To take the example from Section 1.2.1 of Searching and Mining Trillions of Time Series Subsequences under Dynamic Time Warping from the linked question above, the movement of fish in two different habitats is analogous to the action of drawing a gun or pointing a finger. The reason for z-normalization in the gun-point dataset, according to the author, is to account for offsets in scaling of the video. But in this case all of the data is normalized already to the global marine signature to account for machine drift, and the isotopic values are extremely precise and accurate. The error in amplitude of the curves is less than 1%. Is z-normalization required here, or is it just erasing meaningful differences in amplitude that are correctly classified without z-normalization?
I'm curious not just to find an answer regarding my own data, but also because it has been really difficult for me to find a straightforward discussion of this type of amplitude problem in the literature. Most of the advice is a blanket, "In 99% of cases, you must z-normalize." as eamonn stated in the other question...an opinion I respect given his work on this subject. But, I'm curious about what those 1% of examples are. Perhaps I'm just missing it, or perhaps I'm missing the boat completely. Your thoughts, and explanations, would be greatly appreciated.

