4
$\begingroup$

I am facing a classification problem with classes that are really imbalanced (more or less 1% of positive cases). In addition, the "cost" of a False Negative (FN) is much higher than the cost of False Positive (FP).

Considering so, I decided to insert the weights into my classification model. Which is the best way to compute these weights? Ideally, the weights have to take into account both the data unbalancing and the miss-classification cost.

I am not interested in putting a 0/1 label to each record, but just in ordering the test dataset according to the output score. The idea is to contact the records with the highest score to offer a product.

I would like to use these weights using, for example, the sample_weights parameter available in most of scikit-learn classification algorithm (here the documentation).

Is it a good idea to oversample/downsample the data and then use the weight only to control the miss-classification cost? Or would it be better to use weights that are able to consider the whole situation? Are there any known ways to compute these weights?

$\endgroup$
4
  • $\begingroup$ You can plot an ROC curve (which is indifferent to a change is class weights, I think) and see what's the False Positive Rate you have to tolerate to reach your desired True Positive Rate. $\endgroup$ Commented Jul 15, 2020 at 14:06
  • $\begingroup$ Why you say that ROC curve is no sensitive to weights? I think that if I insert the weights, the model will change its behavior during training (let's think at the gradient in XGBoost, where the it has an impact also on the leaf of each tree), and so the order itself will change. As I know, ROC is insensitive to a specific threshold, but if the model itself changes, the ROC will be different $\endgroup$
    – A1010
    Commented Jul 15, 2020 at 15:12
  • $\begingroup$ In broad terms: I think that the ROC is only dependent on the order of the predicted probability that each score is in the positive class, and that the class weights only change the constant term in the final sigmoid. $\endgroup$ Commented Jul 16, 2020 at 6:25
  • $\begingroup$ Do you have any reference about this? I am interested only in the ordering of the scores (I do not put any 0/1 label), so if the order is no sensitive to the weights, it has no sense. As far as I know, the weights impact also the gradient in XGBoost, so the tree-structure itself will change and so the order is not the same $\endgroup$
    – A1010
    Commented Jul 16, 2020 at 6:55

2 Answers 2

4
$\begingroup$

Not clear if you are saying the cost of a FN or a FP is higher, you only mention FN in your statement. Think that you mean a FN is more costly and that a positive means a 1.

In general, if an incorrect prediction for the minority case is more costly (FN), you should sample that minority case higher or the majority case lower so the ratio is closer to 1:1. Balancing will help increase the accuracy of your model when predicting the minority case. Accuracy in predicting the majority case will already be higher as there are more samples to use for that case. Undersampling, oversampling and SMOTE are all useful ways to accomplish this balancing of samples, and each has their own strengths and weaknesses.

However, doing this sample balancing will quickly increase the number of FP, so even though the cost may be lower for a FP, the cost will add up quickly. For example, every 1 FP that you decrease, you may get 10 or 20 more FN

After doing this balancing, you can start to adjust the weights to get the best ratio of FN to FP, trying to get the total cost as low as possible.

minimizing: total cost = FN x cost_of_fn + FP x cost_of_fp

Not sure if there is a mathematical equation to solve this, but you can run this iteratively, change weight ratios for the 2 classes, and calculate the total cost using a confusion matrix to get FN and FP, and graph the results for cost (y) vs weight ratio(x), looking for a minima. I would start with a ratio that is equal to the ratio of your costs.

Example: If the cost of a FN is 10 dollars and the cost of a FP is 1 dollar, then the ratio should be 10:1 for minority:majority class

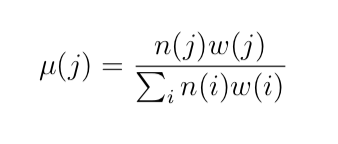
A straightforward calculation shows how to derive the desired mix of class i: μ(i) in terms of the calculated weight w(i) and number of examples in the training set (before any up or down sampling) n(i). This formula is given below:

enter image description here

Reference: https://medium.com/rv-data/how-to-do-cost-sensitive-learning-61848bf4f5e7

$\endgroup$
9
  • $\begingroup$ you are right, I edit the question. I am currently trying the approach you suggested. Anyway the performance are not so good. If I make the class baancing (both over and under sampling) and I also add the different cost of miss-classification, the performance are worse. In order to evaluate the performance, I cut the ranking at a specific percentile (let's say 1%, 5%, 10%, ...) and I analyze how many TP and TN there are inside and the total cost formula. Do you think that it is a good way to evaluate the performance? $\endgroup$
    – A1010
    Commented Jul 15, 2020 at 15:16
  • $\begingroup$ for clarity, what are you using for measuring performance, and what do you mean by "output score"? For an imbalanced dataset, it will be difficult to get good performance on both FP and FN. You can look at the ROC/AUC to see how the model does in general for both classes. You can also look at this curve to possibly change the cutoff for 0/1. It is set to 0.5, but you can override that by using the predict_proba and setting your own prediction with your custom cutoff. Other metrics to look at are F1, precision and recall. $\endgroup$
    – Donald S
    Commented Jul 15, 2020 at 15:25
  • $\begingroup$ I sort the test dataset according to the output score (a probability) for the positive class. Obviously, if I do not balance the classes, the score is really small. Since I sort the record, I decide the cut-off point looking at the percentile of the distribution (so, regardless of the score-values, I mark as positive the first t% (t should be 1, 5, ...) of the test set. By this way I have not to be care about the cut-off point. In addition, for the specific business problem, I will cut the test dataset looking at the percentiles, not at the scores. What do you think about this approach? $\endgroup$
    – A1010
    Commented Jul 15, 2020 at 15:35
  • 1
    $\begingroup$ I have not heard of any other approach to this calculation. The usual goal in this use case is to minimize the total cost which means minimizing the equation I included above: total cost = FN x cost_of_fn + FP x cost_of_fp $\endgroup$
    – Donald S
    Commented Jul 16, 2020 at 0:51
  • 1
    $\begingroup$ If you choose oversampling with the minority case, that can certainly lead to overfitting. However, if you apply the typical methods (choose an algorithm robust to overfitting, cross validate, use regularization, avoid data leakage between train and test, feature reduction, using the correct metrics, etc) to prevent overfitting, setting high weights and sampling to balance classes should not be a concern and any overfitting can be mitigated $\endgroup$
    – Donald S
    Commented Jul 16, 2020 at 15:27
3
$\begingroup$

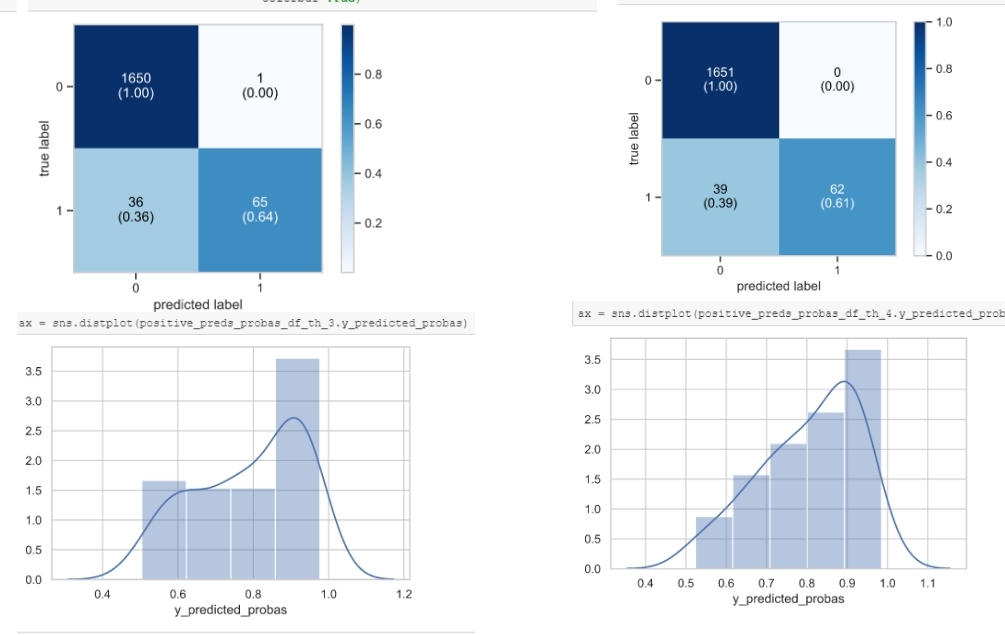
Supporting the second answer by Donald, I would also try to look at the predicted probabilities (via the predict_proba attribute in scikit learn classifiers) and customize your predictions by selecting the threshold (which you can check also in the corresponding ROC curve) which gives you the most robust (i.e. highest) predicted probabilities distributions, so your classifier is "sure" about what is predicting, something like: enter image description here here, the classifier on the right seems to give more robust predictions, although the confusion matrix on the right seems to be a little bit better).

You can also use metrics like recall, which gives a less optimistic and more realistic result (Recall is a metric that quantifies the number of correct positive predictions made out of all positive predictions that could have been made, source: https://machinelearningmastery.com/roc-curves-and-precision-recall-curves-for-imbalanced-classification/)

$\endgroup$
5
  • 1
    $\begingroup$ thank you! I am not interested in putting a 0/1 label for each record. Using the output score, I sort the test dataset and I cut the record at a specific percentile (let's say 10% of the test dataset). The records that fall into the first 10% will be 1, the others 0. Do you believe that in this scenario the class balancing and the cost-sensitive learning could improve the performance? Basically, I am not interested in the specific score, but just in the ranking $\endgroup$
    – A1010
    Commented Jul 15, 2020 at 17:30
  • 2
    $\begingroup$ I would focus on the main aim, which is providing that ranking, but knowing that the classification is good enough for not contacting the wrong users. I would first try to build a robust enough classifier (by over/under sampling for instancwe), and then I would try to optimize the class weights to get the highest probabilities for that top 10% of the users in your ranking. $\endgroup$
    – German C M
    Commented Jul 16, 2020 at 7:41
  • $\begingroup$ So you will use the weights after the training step, right? Originally, I would like to insert the weights directly into the training, modifying the loss function according to a value w that is class-specific. $\endgroup$
    – A1010
    Commented Jul 16, 2020 at 12:51
  • 1
    $\begingroup$ Maybe you could also try to treat those class weights as hyperparameters which you can tune with bayesian hyperparametrization, while still considering the cost based on FN & FP your final evaluation metric (I will try to implement an example of this in case I see it feasible) $\endgroup$
    – German C M
    Commented Jul 18, 2020 at 8:20
  • $\begingroup$ ook thank you. I will check if you will implement an example. it will be really usefull $\endgroup$
    – A1010
    Commented Jul 20, 2020 at 8:55

Your Answer

By clicking “Post Your Answer”, you agree to our terms of service and acknowledge you have read our privacy policy.

Not the answer you're looking for? Browse other questions tagged or ask your own question.