3
$\begingroup$

I trained an SVM model with GridSearch

svc = SVC()
parameters = {
  'kernel': ['linear', 'rbf'],
  'C': [0.1, 1, 10]
}

cv = GridSearchCV(svc, parameters, cv=5)
cv.fit(v_train, y_train)

print_results(cv)

Here is the result I got:

BEST PARAMS: {'C': 1, 'kernel': 'linear'}

0.912 (+/-0.037) for {'C': 0.1, 'kernel': 'linear'}
0.763 (+/-0.027) for {'C': 0.1, 'kernel': 'rbf'}
0.942 (+/-0.045) for {'C': 1, 'kernel': 'linear'}
0.903 (+/-0.044) for {'C': 1, 'kernel': 'rbf'}
0.94 (+/-0.043) for {'C': 10, 'kernel': 'linear'}
0.928 (+/-0.046) for {'C': 10, 'kernel': 'rbf'}

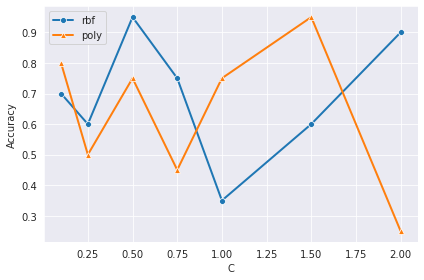
What is the best way to plot this result? in one plot that both contain the C parameter and kernel with their corresponding accuracy.

Thank you.

$\endgroup$

2 Answers 2

1
$\begingroup$

What I would suggest is to have put the results as a Data frame with

pd.DataFrame(cv.cv_results_)

And then you have the data in a dataframe which is easier to handle.

For the other question (in your comments), once you have the data in a nice dataframe is just about data visualization. How can you put it in a nice visualization?

The easier are either 2d plots or 3d or even contour plots. By googling them and python you will get nice tutorials on how to do it

$\endgroup$
0
$\begingroup$

You can use a simple lineplot.

enter image description here

$\endgroup$
1
  • $\begingroup$ Thank you for your reply, it actually helped. What if I had three parameters and accuracy, e.g. C, kernel and gamma, how would you recommend to plot it? $\endgroup$
    – AziZ
    Commented Nov 29, 2020 at 12:31

Your Answer

By clicking “Post Your Answer”, you agree to our terms of service and acknowledge you have read our privacy policy.

Not the answer you're looking for? Browse other questions tagged or ask your own question.