2
$\begingroup$

I have a data containing 200K ads (sale and rent property in the United Arab Emirates, or UAE). Here is a sample:

190459 obs. of  29 variables:
 $ id                  : chr  "tnydu.biz/DafdVO" "tnydu.biz/DafloP" "tnydu.biz/Dafmvy" "tnydu.biz/Dafuy5" ...
 $ AdType              : chr  "sale" "sale" "sale" "sale" ...
 $ AgencyFees          : num  NA NA NA NA NA NA NA NA NA NA ...
 $ Amenities           : chr  "CentralA/C&Heating,SharedPool,SharedGym,Security,BuiltinWardrobes,ViewofWater,ViewofLandmark" "Study,CentralA/C&Heating,Balcony,Security,MaidService,CoveredParking,BuiltinWardrobes,Walk-inCloset,BuiltinKitchenAppliances,Vi"| __truncated__ "CentralA/C&Heating,SharedSpa,Security,ConciergeService,MaidService,CoveredParking,BuiltinWardrobes,Walk-inCloset,BuiltinKitchen"| __truncated__ "CentralA/C&Heating,Balcony,Security,CoveredParking,BuiltinWardrobes,BuiltinKitchenAppliances,ViewofLandmark" ...
 $ AnnualCommunityFee  : chr  "9000" NA NA NA ...
 $ AreaDescription     : chr  "\r\n            \r\n                \r\n                    1.9 km from Najmat Reem Marina\r\n                \r\n            \"| __truncated__ "\r\n            \r\n                \r\n                    0.3 km from The Dubai Mall\r\n                \r\n            \r\n "| __truncated__ "\r\n            \r\n                \r\n            \r\n        " "\r\n            \r\n                \r\n                    0.7 km from The Dubai Mall\r\n                \r\n            \r\n "| __truncated__ ...
 $ Bathrooms           : num  1 NA NA NA 5 3 NA NA 3 3 ...
 $ Bedrooms            : num  0 3 0 1 3 2 2 2 3 3 ...
 $ Building            : chr  "HydraAvenueTowers" "BurjVista1" "TheAddressDubaiMall" "TheAddressDowntown" ...
 $ City                : chr  "AbuDhabi" "Dubai" "Dubai" "Dubai" ...
 $ PublishDate         : POSIXct, format: "2015-10-30" "2015-11-11" "2015-11-13" "2015-11-09" ...
 $ DealerCode          : chr  "599942" "604296" "604296" "604296" ...
 $ DealerName          : chr  "STARWOOD PROPERTIES BROKER" "BLUE PALACE REAL ESTATE BROKERS" "BLUE PALACE REAL ESTATE BROKERS" "BLUE PALACE REAL ESTATE BROKERS" ...
 $ Developer           : chr  "HydraProperties" "EMAAR" "EMAAR" NA ...
 $ Furnished           : chr  NA NA NA NA ...
 $ ListedBy            : chr  "Agent" "Agent" "Agent" "Agent" ...
 $ Location            : chr  "City of Lights, Tamouh Marina Square" "Downtown Dubai, Dubai" "Downtown, Cairo" "Downtown Dubai, Dubai" ...
 $ LocationGPSLatitude : num  24.5 25.2 30 25.2 25.1 ...
 $ LocationGPSLongitude: num  54.4 55.3 31.3 55.3 55.1 ...
 $ Price               : num  900000 3822888 2150000 3200000 5500000 ...
 $ PriceSqFt           : num  1129 2185 3909 3422 2431 ...
 $ PropertyReference   : chr  NA "BP9801" "DT-K20" " BP8958" ...
 $ PropertyType        : chr  "apartment" "apartment" "apartment" "apartment" ...
 $ ReadyBy             : POSIXct, format: "2015-04-30" NA NA NA ...
 $ RentIsPaid          : chr  NA NA NA NA ...
 $ ShortLink           : chr  "tnydu.biz/DafdVO" "tnydu.biz/DafloP" "tnydu.biz/Dafmvy" "tnydu.biz/Dafuy5" ...
 $ Size                : num  797 1749 550 935 2262 ...
 $ TotalClosingFee     : chr  NA NA NA NA ...
 $ VirtualView         : chr  NA NA NA NA ...

I'm looking for help figuring out what kind of questions I can answer using these data. For example, 1. What the mean price per year for a 1-bedroom apartment to rent in different areas of Dubai? 2. How are supplies for apartments and villas distributed on the city map? 3. Does the number of bathrooms influence on sale/rent price? 4. Where is the best place for investing to get more profit from apartment cost and rent revenue?

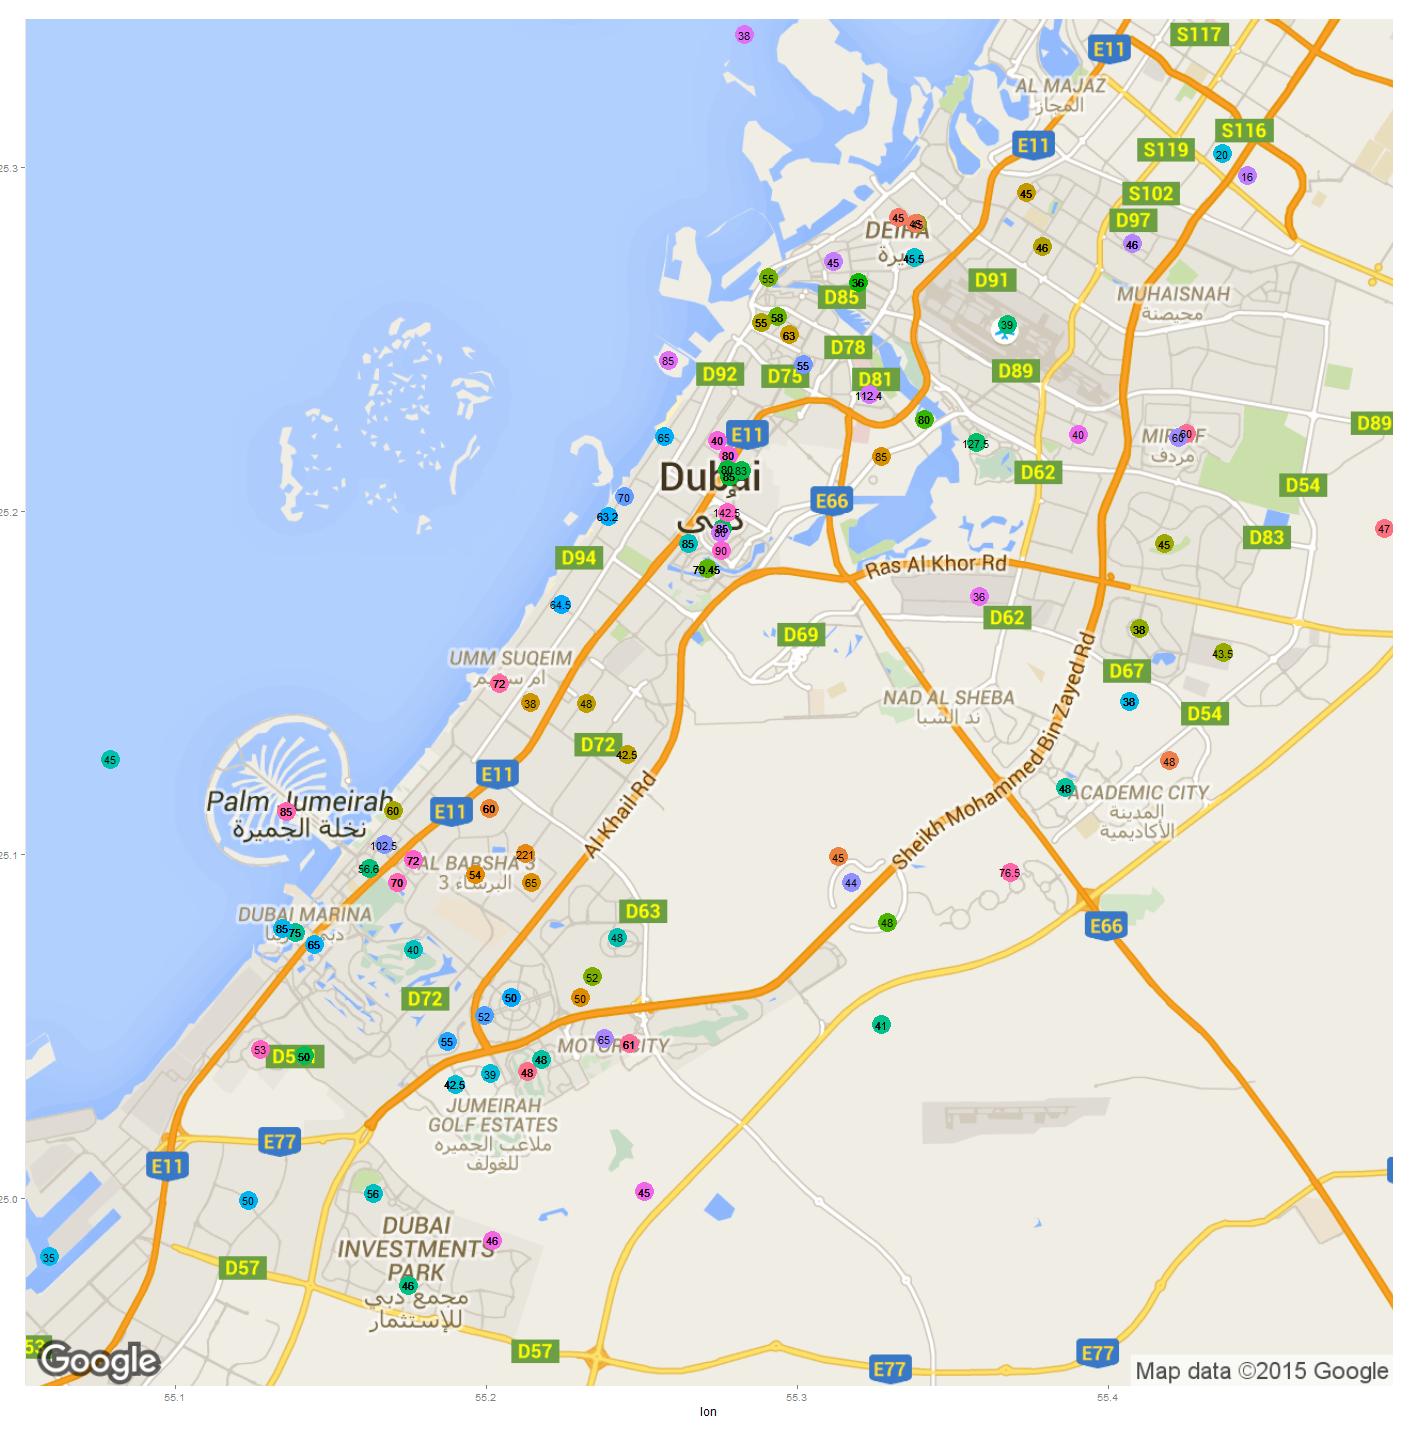
I have already done some of this (plotted the map with mean price for studio in Dubai in thousands AED/year, 1USD = 3.66AED):

enter image description here

From your experience, what other questions can I ask? What I have to be aware in this data set? I can share my data set if anyone want to examine it (it is a 12mb zip).

$\endgroup$
6
  • $\begingroup$ Are you using this for playing around with the dataset (for learning process) or for solving a specific problem? $\endgroup$
    – Dawny33
    Commented Nov 23, 2015 at 5:51
  • $\begingroup$ For both. I am trying to implement the skills I got on the courses and also I want to do some kind of project that I can offer to real estate magazine and use it in my CV. I'm new in data science and I need as more done work as I can. $\endgroup$ Commented Nov 23, 2015 at 5:56
  • $\begingroup$ Okay. And welcome to the site! :) $\endgroup$
    – Dawny33
    Commented Nov 23, 2015 at 5:58
  • 3
    $\begingroup$ I suggest looking at recent previous real estate publications to see what the industry is talking about. Then base your analysis on answering a few questions on those concepts. $\endgroup$
    – Edmund
    Commented Nov 23, 2015 at 10:50
  • 1
    $\begingroup$ Please share your data set. Upload it to somewhere public like Github or Google Docs. $\endgroup$
    – Spacedman
    Commented Nov 25, 2015 at 18:15

4 Answers 4

2
$\begingroup$

There are several things that can be done, however as @Dawny33 mentioned, start with the problem you want solved.

As an example, If I was trying to solve: Which factors, influence the prices and how?

A simple analysis could be to run a linear regression model (lm) with PriceSqFt as a dependent variable and others as regressors. You can then select top 10 or 15 or how so ever many you like and look at their relationship.

This may help you answer some simple questions like:

How do prices vary by dealers, by property type, by location, by size?
Does move in ready date make a difference to rent / prices?
Do specific kind of properties have later than usual ready dates?
Is there a negative or positive correlation between size and pricesqft?
Are certain dealers over or under priced compared to other identical
properties and location?  

You can also create a plots using pairs or other functions to look at pairwise relationship for initial analysis and building on top of what you see.

If you really want to take it a to the next level, you can create a prediction model to predict the price based on select parameters.

$\endgroup$
0
$\begingroup$

Feature Selection is a pretty good starting point. U can use statistical or information theoretic approaches (e.g. variance, entropy, ...) to choose k best features which influence the data.

Clustering seems attractive here as well. Cluster houses based on different properties to disclose hidden pattern e.g. the relation between geographic location and price as a simple one.

You can also build a model from which one can predict the price of a house given its features.

$\endgroup$
0
$\begingroup$

Geographically weighted regression would be one way to see what factors correlate with price and how that model changes over space.

Used with caution it can also help predict expected prices in the intervening locations i.e. if the data points are suitably distributed.

GWR is available in e.g. R and ArcGIS

$\endgroup$
0
$\begingroup$

You already have ideas about potential questions. To get some more, you can try to test different types of visualizations, and check whether patterns appear.

For your inspiration, this visual introduction to machine learning starts from a 7-dimension dataset of homes in San Francisco or in New York, and build different types of great graphics and predictions.

$\endgroup$

Your Answer

By clicking “Post Your Answer”, you agree to our terms of service and acknowledge you have read our privacy policy.

Not the answer you're looking for? Browse other questions tagged or ask your own question.