fixing my horrific noob formatting
Source Link

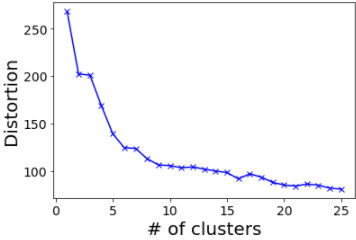
I've found two different approaches online when using the Elbow Method to determine the optimal number of clusters for K-Means.

One approach is to use the following code:

distortions_2.append(sum(np.min(cdist(data,
                              ,        kmeanModel.cluster_centers_,
                              ,        'euclidean'),
                              ,  axis = 1)) / data.shape[0])
enter image description here

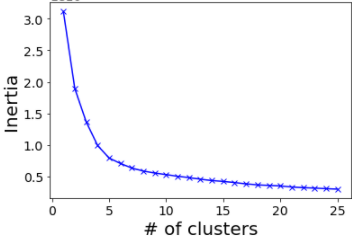
Another is to use inertia_ from sklearn.cluster.KMeans:

distortions_3.append(kmeanModel.inertia_)
enter image description here

When I plot the results (using the same random states) both give different results but I'm not sure what the differences are, can anyone help?

Edit: If I replace the normalisation factor / data.shape[0] with squared **2 as suggested below, then I still don't get the same as for the inertia plot:

distortions_2.append(sum(np.min(cdist(data, 
                              ,        kmeanModel.cluster_centers_, 
                              ,        'euclidean'), 
                              ,  axis = 1)) ** 2)

Using squared just makes the plot a little smoother, but definitely not the same as using intertia_, I'm just not quite sure how inertia_ is calculated and what it means.

I've found two different approaches online when using the Elbow Method to determine the optimal number of clusters for K-Means.

One approach is to use the following code:

distortions_2.append(sum(np.min(cdist(data
                              , kmeanModel.cluster_centers_
                              , 'euclidean')
                              , axis = 1)) / data.shape[0])

enter image description here

Another is to use inertia_ from sklearn.cluster.KMeans:

distortions_3.append(kmeanModel.inertia_)

enter image description here

When I plot the results (using the same random states) both give different results but I'm not sure what the differences are, can anyone help?

Edit: If I replace the normalisation factor / data.shape[0] with squared **2 as suggested below, then I still don't get the same as for the inertia plot:

distortions_2.append(sum(np.min(cdist(data
                              , kmeanModel.cluster_centers_
                              , 'euclidean')
                              , axis = 1)) ** 2)

Using squared just makes the plot a little smoother, but definitely not the same as using intertia_, I'm just not quite sure how inertia_ is calculated and what it means.

I've found two different approaches online when using the Elbow Method to determine the optimal number of clusters for K-Means.

One approach is to use the following code:

distortions_2.append(sum(np.min(cdist(data,
                                      kmeanModel.cluster_centers_,
                                      'euclidean'),
                                axis = 1)) / data.shape[0])

enter image description here

Another is to use inertia_ from sklearn.cluster.KMeans:

distortions_3.append(kmeanModel.inertia_)

enter image description here

When I plot the results (using the same random states) both give different results but I'm not sure what the differences are, can anyone help?

Edit: If I replace the normalisation factor / data.shape[0] with squared **2 as suggested below, then I still don't get the same as for the inertia plot:

distortions_2.append(sum(np.min(cdist(data, 
                                      kmeanModel.cluster_centers_, 
                                      'euclidean'), 
                                axis = 1)) ** 2)

Using squared just makes the plot a little smoother, but definitely not the same as using intertia_, I'm just not quite sure how inertia_ is calculated and what it means.

added 34 characters in body
Source Link

I've found two different approaches online when using the Elbow Method to determine the optimal number of clusters for K-Means.

One approach is to use the following code:

distortions_2.append(sum(np.min(cdist(data
                              , kmeanModel.cluster_centers_
                              , 'euclidean')
                              , axis = 1)) / data.shape[0])

enter image description here

Another is to use inertia_ from sklearn.cluster.KMeans:

distortions_3.append(kmeanModel.inertia_)

enter image description here

When I plot the results (using the same random states) both give different results but I'm not sure what the differences are, can anyone help?

Edit: If I replace the normalisation factor / data.shape[0] with squared **2 as suggested below, then I still don't get the same as for the inertia plot:

distortions_2.append(sum(np.min(cdist(data
                              , kmeanModel.cluster_centers_
                              , 'euclidean')
                              , axis = 1)) ** 2)

Using squared just makes the plot a little smoother, but definitely not the same as using intertia_, I'm just not quite sure how inertia_ is calculated and what it means.

enter image description here

I've found two different approaches online when using the Elbow Method to determine the optimal number of clusters for K-Means.

One approach is to use the following code:

distortions_2.append(sum(np.min(cdist(data
                              , kmeanModel.cluster_centers_
                              , 'euclidean')
                              , axis = 1)) / data.shape[0])

Another is to use inertia_ from sklearn.cluster.KMeans:

distortions_3.append(kmeanModel.inertia_)

When I plot the results (using the same random states) both give different results but I'm not sure what the differences are, can anyone help?

Edit: If I replace the normalisation factor / data.shape[0] with squared **2 as suggested below, then I still don't get the same as for the inertia plot:

distortions_2.append(sum(np.min(cdist(data
                              , kmeanModel.cluster_centers_
                              , 'euclidean')
                              , axis = 1)) ** 2)

Using squared just makes the plot a little smoother, but definitely not the same as using intertia_, I'm just not quite sure how inertia_ is calculated and what it means.

enter image description here

I've found two different approaches online when using the Elbow Method to determine the optimal number of clusters for K-Means.

One approach is to use the following code:

distortions_2.append(sum(np.min(cdist(data
                              , kmeanModel.cluster_centers_
                              , 'euclidean')
                              , axis = 1)) / data.shape[0])

enter image description here

Another is to use inertia_ from sklearn.cluster.KMeans:

distortions_3.append(kmeanModel.inertia_)

enter image description here

When I plot the results (using the same random states) both give different results but I'm not sure what the differences are, can anyone help?

Edit: If I replace the normalisation factor / data.shape[0] with squared **2 as suggested below, then I still don't get the same as for the inertia plot:

distortions_2.append(sum(np.min(cdist(data
                              , kmeanModel.cluster_centers_
                              , 'euclidean')
                              , axis = 1)) ** 2)

Using squared just makes the plot a little smoother, but definitely not the same as using intertia_, I'm just not quite sure how inertia_ is calculated and what it means.

deleted 42 characters in body
Source Link

I've found two different approaches online when using the Elbow Method to determine the optimal number of clusters for K-Means.

One approach is to use the following code:

distortions_2.append(sum(np.min(cdist(data
                              , kmeanModel.cluster_centers_
                              , 'euclidean')
                              , axis = 1)) / data.shape[0])

Another is to use inertia_ from sklearn.cluster.KMeans:

distortions_3.append(kmeanModel.inertia_)

When I plot the results (using the same random states) both give different results but I'm not sure what the differences are, can anyone help?

Edit: If I replace the normalisation factor / data.shape[0] with squared **2 as suggested below, then I still don't get the same as for the inertia plot:

distortions_2.append(sum(np.min(cdist(data
                              , kmeanModel.cluster_centers_
                              , 'euclidean')
                              , axis = 1)) ** 2)

Using squared just makes the plot a little smoother, but definitely not the same as using intertia_, I'm just not quite sure how inertia_ is calculated and what it means.

enter image description here

enter image description hereenter image description here

I've found two different approaches online when using the Elbow Method to determine the optimal number of clusters for K-Means.

One approach is to use the following code:

distortions_2.append(sum(np.min(cdist(data
                              , kmeanModel.cluster_centers_
                              , 'euclidean')
                              , axis = 1)) / data.shape[0])

Another is to use inertia_ from sklearn.cluster.KMeans:

distortions_3.append(kmeanModel.inertia_)

When I plot the results (using the same random states) both give different results but I'm not sure what the differences are, can anyone help?

Edit: If I replace the normalisation factor / data.shape[0] with squared **2 as suggested below, then I still don't get the same as for the inertia plot:

distortions_2.append(sum(np.min(cdist(data
                              , kmeanModel.cluster_centers_
                              , 'euclidean')
                              , axis = 1)) ** 2)

Using squared just makes the plot a little smoother, but definitely not the same as using intertia_, I'm just not quite sure how inertia_ is calculated and what it means.

enter image description here

enter image description here

I've found two different approaches online when using the Elbow Method to determine the optimal number of clusters for K-Means.

One approach is to use the following code:

distortions_2.append(sum(np.min(cdist(data
                              , kmeanModel.cluster_centers_
                              , 'euclidean')
                              , axis = 1)) / data.shape[0])

Another is to use inertia_ from sklearn.cluster.KMeans:

distortions_3.append(kmeanModel.inertia_)

When I plot the results (using the same random states) both give different results but I'm not sure what the differences are, can anyone help?

Edit: If I replace the normalisation factor / data.shape[0] with squared **2 as suggested below, then I still don't get the same as for the inertia plot:

distortions_2.append(sum(np.min(cdist(data
                              , kmeanModel.cluster_centers_
                              , 'euclidean')
                              , axis = 1)) ** 2)

Using squared just makes the plot a little smoother, but definitely not the same as using intertia_, I'm just not quite sure how inertia_ is calculated and what it means.

enter image description here

added 166 characters in body
Source Link
Loading
added 4 characters in body
Source Link
Loading
added 550 characters in body
Source Link
Loading
Source Link
Loading