5
$\begingroup$

I've found two different approaches online when using the Elbow Method to determine the optimal number of clusters for K-Means.

One approach is to use the following code:

distortions_2.append(sum(np.min(cdist(data,
                                      kmeanModel.cluster_centers_,
                                      'euclidean'),
                                axis = 1)) / data.shape[0])
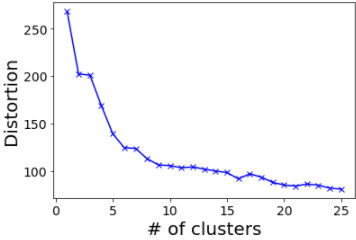
enter image description here

Another is to use inertia_ from sklearn.cluster.KMeans:

distortions_3.append(kmeanModel.inertia_)
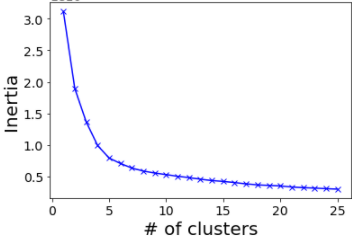
enter image description here

When I plot the results (using the same random states) both give different results but I'm not sure what the differences are, can anyone help?

Edit: If I replace the normalisation factor / data.shape[0] with squared **2 as suggested below, then I still don't get the same as for the inertia plot:

distortions_2.append(sum(np.min(cdist(data, 
                                      kmeanModel.cluster_centers_, 
                                      'euclidean'), 
                                axis = 1)) ** 2)

Using squared just makes the plot a little smoother, but definitely not the same as using intertia_, I'm just not quite sure how inertia_ is calculated and what it means.

$\endgroup$
3
  • 2
    $\begingroup$ Please do not post duplicates! stackoverflow.com/q/50467835/1060350 $\endgroup$ May 23, 2018 at 5:07
  • $\begingroup$ Apologies! I've requested a merge $\endgroup$
    – lstodd
    May 23, 2018 at 9:48
  • $\begingroup$ Show ALL your code!!! Show the plot you got for the corrected equation. Come on man, you need to help yourself for us to help you. $\endgroup$
    – JahKnows
    May 25, 2018 at 0:52

1 Answer 1

2
$\begingroup$

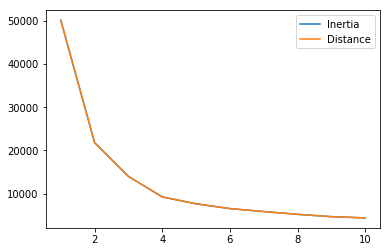
You will notice that the inertia is the sum of squared distance between each point and its nearest cluster center. Thus by removing the normalization term / data.shape[0] and instead replacing that by a squared **2 these two expressions will be equivalent

distortions_2.append(sum(np.min(cdist(data
                              , kmeanModel.cluster_centers_
                              , 'euclidean')
                              , axis = 1)) **2)

and

distortions_2.append(kmeanModel.inertia_)

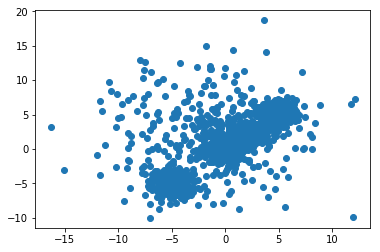
For example using this artificial data source, where we generate 5 Gaussian distributions with 300 points in each.

params = [[[ 0,1],  [ 0,1]], 
          [[ 5,1],  [ 5,1]], 
          [[-2,5],  [ 2,5]],
          [[ 2,1],  [ 2,1]],
          [[-5,1],  [-5,1]]]

n = 300
dims = len(params[0])

data = []
y = []
for ix, i in enumerate(params):
    inst = np.random.randn(n, dims)
    for dim in range(dims):
        inst[:,dim] = params[ix][dim][0]+params[ix][dim][1]*inst[:,dim]
        label = ix + np.zeros(n)

    if len(data) == 0: data = inst
    else: data = np.append( data, inst, axis= 0)
    if len(y) == 0: y = label
    else: y = np.append(y, label)

num_clusters = len(params)

enter image description here

We will then apply KMeans using different number of clusters

k = [1,2,3,4,5,6,7,8,9,10]

inertias = []
dists = []

for i in k:
    kmeans = KMeans(i)
    kmeans.fit(data)
    inertias.append(kmeans.inertia_)
    dists.append(sum(np.min(spatial.distance.cdist(data, kmeans.cluster_centers_, 'euclidean'), axis=1)**2))

plt.plot(range(1, len(inertias)+1), inertias, label = 'Inertia')
plt.plot(range(1, len(dists)+1), dists, label = 'Distance')
plt.legend()
plt.show()

enter image description here

$\endgroup$
4
  • $\begingroup$ Thanks for your response! I've tried plotting the same graph but using squared instead of normalizing as above, but I get the same shaped graph just a bit more smooth. It's totally different from the plot I get using inertia_ from KMeans so I still think I'm missing something $\endgroup$
    – lstodd
    May 23, 2018 at 10:48
  • $\begingroup$ Copy my code exactly as you see it. Or update your question with the entirety of your code and I'll correct it. $\endgroup$
    – JahKnows
    May 23, 2018 at 10:49
  • $\begingroup$ I have edited the question above, the formula I've used and inertia_ are different as the resultant plots are quite different $\endgroup$
    – lstodd
    May 24, 2018 at 9:35
  • $\begingroup$ @Istodd, can you show me your whole code please? What is distortions_2 and distortions_3, these must be the same. Just paste your code please. $\endgroup$
    – JahKnows
    May 24, 2018 at 9:48

Your Answer

By clicking “Post Your Answer”, you agree to our terms of service and acknowledge you have read our privacy policy.

Not the answer you're looking for? Browse other questions tagged or ask your own question.