21
$\begingroup$

I’m posting this question, and an answer, to help dispel a few misunderstandings about what p-values are. As a hiring manager interviewing mid-level and senior data scientists, I have noticed these misunderstandings many times. I have also noticed several posts here on DS.SE where the poster has misinterpreted, or misunderstood, p-values, so rather than point it out every time with details, I thought it better to make a question and answer on the topic. The intention is to hopefully create a "canonical" Q&A that the community can refer to, if/when appropriate. I would welcome any comments in case I have made any mistakes.

What follows is very heavily based on the paper by Haller and Krauss (2002) who investigated misconceptions about null hypothesis significance testing (NHST) among three groups: psychology students, scientific psychologists, and methodology instructors teaching statistics to Psychology students German universities. They used a survey consisting of six statements about the interpretation of a p-value derived from a t-test. Participants were asked to classify each statement as "true" or "false".


A questionnaire:

Suppose you have a treatment that you suspect may alter performance on a task. You compare the means of your control and experimental groups (say 20 subjects in each sample). Then, you use an independent means t-test and your result is (t = 2.7, d.f. = 18, p = 0.01). Please choose "true" or "false", and note that several or none of the statements may be correct.

  1. You have disproved the null hypothesis (that is, there is no difference between the population means).
  2. You have found the probability of the null hypothesis being true.
  3. You have proved your experimental hypothesis (that there is a difference between the population means).
  4. You can deduce the probability of the experimental hypothesis being true.
  5. You know, if you decide to reject the null hypothesis, the probability that you are making the wrong decision.
  6. You have a reliable experimental finding in the sense that if, hypothetically, the experiment were repeated a great number of times, you would obtain a significant result on 99% of occasions.

I would encourage everyone reading this to think deeply about these questions and come up with their answers, before reading my answer which follows. I would also encourage people to read the Haller and Krauss (2002) paper on which this is based (there is a link to the pdf in the References section)

References

  • Haller, H., & Krauss, S. (2002). Misinterpretations of significance: A problem students share with their teachers. Methods of Psychological Research, 7(1), 1–20. PDF
$\endgroup$
6
  • 1
    $\begingroup$ "The Null Ritual" by Gigerenizer et all is also well worth a read on this topic (it cites Haller and Krauss) pure.mpg.de/rest/items/item_2101291/component/file_3080636/… $\endgroup$ Commented Nov 18 at 19:44
  • $\begingroup$ The most important misinterpretation of p-values is that a significant outcome is telling you something useful. NHSTs are most useful when you get a non-significant outcome, which makes you reign in your enthusiasm for your research hypothesis and makes you go and do more research rather than say something wrong in print ;o) $\endgroup$ Commented Nov 18 at 19:50
  • 1
    $\begingroup$ @DikranMarsupial Ahh yes ! I remember reading that some time ago. An excellent reference - thank you. If I'm not mistaken, that's how I came across Haller and Krauss in the first place :) $\endgroup$ Commented Nov 18 at 19:51
  • 1
    $\begingroup$ @DikranMarsupial Re: your 2nd comment - thank you again. Another important point, also touching on publication bias. Having spent a large part of my academic career working with medical clinicians (ie.,doctors), it is something I had to bang my head against the wall about many times ! $\endgroup$ Commented Nov 18 at 19:53
  • $\begingroup$ Considering how incredibly rare it is for anyone to care about the thing that p-value actually measures, one might argue that the correct conclusion to draw upon seeing one is, "The author does not have a particularly deep understanding of probability theory". :-) $\endgroup$
    – Ray
    Commented Nov 19 at 22:51

2 Answers 2

19
$\begingroup$
TL;DR:

Use Bayesian methods when we wish to obtain results that allow us to directly estimate the probability of hypotheses given the data (or most of the other wishful thinking that abounds on the topic).


Understanding P-Values and Addressing Misconceptions

Definition of a P-Value

The p-value is defined as:

$$ \mathcal{P}(|\mathcal{T}| \geq |t| \mid \mathcal{H_0}), $$

where:

  • $\mathcal{T}$ is the test statistic, a random variable, which follows a known probability distribution under the null hypothesis ($\mathcal{H_0}$). For an independent means t-test, $\mathcal{T}$ follows a t-distribution under $\mathcal{H_0}$.
  • $t$ is the observed value of the test statistic, calculated from the sample data.
  • $\mathcal{H_0}$ is the null hypothesis.

In the specific scenario described in the question, the research question does not specify a directional hypothesis (eg., whether performance increases or decreases due to treatment). Therefore, a two-sided test is conducted. This means the p-value considers both tails of the distribution and represents the probability of observing a test statistic at least as extreme as the observed value ( $t$ ), in either direction, under $\mathcal{H_0}$.

If the research question had specified a directional hypothesis (eg., whether treatment improves performance), a one-sided test could have been conducted. However, for the given study design, the two-sided test is appropriate.


Addressing the Questionnaire Statements

  1. False. A p-value cannot "prove" or "disprove" $\mathcal{H_0}$. It quantifies the evidence against $\mathcal{H_0}$ but is inherently probabilistic. For example, consider flipping a fair coin. Even if you observe an extreme outcome, such as ten heads in a row, this result does not "disprove" the fairness of the coin. It only suggests the outcome is unlikely under $\mathcal{H_0}$. Similarly, a low p-value suggests that the observed data is unlikely under $\mathcal{H_0}$, but it does not provide certainty.

  2. False. The p-value reflects $\mathcal{P}(|\mathcal{T}| \geq |t| \mid \mathcal{H_0})$, not $\mathcal{P}(\mathcal{H_0} \mid \mathcal{D})$ (the probability of the null hypothesis being true given the data). For example, consider testing for a rare disease where the null hypothesis ($\mathcal{H_0}$) is "no disease." Even if the test has a low false-positive rate (eg., 1%), the disease's rarity (eg., 1 in a billion people) makes it much more likely that a positive test result is a false positive rather than a true positive. This highlights that the p-value does not directly measure the probability of $\mathcal{H_0}$.

  3. False. A p-value does not "prove" the alternative hypothesis ($\mathcal{H_1}$). If you cannot disprove $\mathcal{H_0}$ (see (1)), you cannot "prove" $\mathcal{H_1}$. Logically, proving $\mathcal{H_1}$ would imply disproving $\mathcal{H_0}$, which the p-value does not achieve. The two hypotheses are complementary in classical hypothesis testing, but neither is proved or disproved definitively.

  4. False. Frequentist methods cannot calculate $\mathcal{P}(\mathcal{H_1} \mid \mathcal{D})$ without incorporating priors. Using the rare disease example from (2), knowing the false-positive rate does not tell you how likely it is that someone who tests positive actually has the disease. This probability depends on the disease’s prevalence in the population. For instance, if the disease is prevalent in 100% of the population, the probability of the experimental hypothesis ($\mathcal{H_1}$) being true is 100%. If it is present in 0%, the probability is 0%. Priors matter.

  5. False. The p-value does not directly measure the Type I error rate ($\alpha$) or the probability of making a wrong decision in rejecting $\mathcal{H_0}$. The p-value is a conditional probability: the probability of observing data as extreme or more extreme than what was observed, assuming $\mathcal{H_0}$ is true. It does not reflect the error rate across multiple tests or decisions.

  6. False. A p-value of 0.01 does not imply that 99% of replications would yield a significant result. Replicability depends on several factors, including effect size, sample size, and variability. For example, consider an experiment where participants are given tools (eg., formulas) as part of the "treatment" to solve very easy problems. In this setup, every replication might yield a significant result simply because the task structure guarantees success, not because of the p-value. This shows that the p-value alone does not determine replicability.


Results from Haller and Krauss (2002)

As already mentioned, Haller and Krauss (2002) surveyed psychology students, practising psychologists, and statistics instructors using these six statements. The results revealed pervasive misconceptions across all groups, as shown by the percentage of participants who endorsed at least one false statement:

  • Psychology students (1st year): 100%
  • Practising psychologists: 98%
  • Statistics instructors: 80%

A detailed breakdown of the specific misconceptions revealed:

  1. "You have disproved the null hypothesis":
    • Endorsed by 62% of students, 47% of psychologists, and 42% of instructors.
  2. "You have found the probability of the null hypothesis being true":
    • Endorsed by 62% of students, 53% of psychologists, and 47% of instructors.
  3. "You have proved your experimental hypothesis":
    • Endorsed by 84% of students, 77% of psychologists, and 67% of instructors.
  4. "You can deduce the probability of the experimental hypothesis being true":
    • Endorsed by 68% of students, 53% of psychologists, and 50% of instructors.
  5. "You know the probability of making a wrong decision in rejecting the null hypothesis":
    • Endorsed by 53% of students, 47% of psychologists, and 42% of instructors.
  6. "You have a reliable experimental finding in the sense that 99% of replications would yield significant results":
    • Endorsed by 74% of students, 65% of psychologists, and 58% of instructors.

These findings demonstrate that even experienced professionals, including those who teach statistics, frequently misinterpret p-values and NHST. The results underline the need for targeted educational interventions to correct persistent myths and clarify the proper interpretation of p-values.

Roots of Misconceptions

  1. Textbook Errors: Many textbooks propagate incorrect interpretations of p-values, eg., equating them with $\mathcal{P}(\mathcal{H_0} \mid \mathcal{D})$. For example, the book "Introduction to Statistics for Psychology and Education" by Nunally (1975) amazingly contains all of these mistakes:
    • "The improbability of observed results being due to error."
    • "The probability that an observed difference is real."
    • "If the probability is low, the null hypothesis is improbable."
    • "The statistical confidence... with odds of 95 out of 100 that the observed difference will hold up in investigations."
    • "The degree to which experimental results are taken 'seriously.'"
    • "The danger of accepting a statistical result as real when it is actually due only to error."
    • "The degree of faith that can be placed in the reality of the finding."
    • "The investigator can have 95% confidence that the sample mean actually differs from the population mean."
  2. Simplistic Teaching: Overemphasising calculations leads to poor conceptual understanding.
  3. Language Ambiguity: Phrases like "reject $\mathcal{H_0}$" may imply certainty where none exists.
  4. Hybridisation of Paradigms: Combining Fisher’s and Neyman-Pearson frameworks creates confusion (Gigerenzer, 1993).

Expanding the Bayesian Perspective

Using Bayes’ theorem, the posterior probability of $\mathcal{H_0}$ is:

$$ \mathcal{P}(\mathcal{H_0} \mid \mathcal{D}) = \frac{\mathcal{P}(\mathcal{D} \mid \mathcal{H_0}) \mathcal{P}(\mathcal{H_0})}{\mathcal{P}(\mathcal{D})}, $$

where:

  • $\mathcal{P}(\mathcal{H_0})$ is the prior probability of $\mathcal{H_0}$,
  • $\mathcal{P}(\mathcal{D} \mid \mathcal{H_0})$ is the likelihood of the data under $\mathcal{H_0}$,
  • $\mathcal{P}(\mathcal{D})$ is the marginal probability of the data.

Frequentist p-values do not incorporate priors or marginal probabilities, which makes $\mathcal{P}(\mathcal{H_0} \mid \mathcal{D})$ inaccessible without Bayesian tools.


Non-Technical Explanation

Explaining to a non-technical audience what a p-value is can be quite challenging. I have had some success with the following:

The p-value is a measure of how surprising your data would be if the null hypothesis ($H_0$) were true, and can be thought of as the probability of obtaining the data that you got, or data more extreme, if $H_0$ is true. Thus, the low p-value is evidence against the null hypothesis.


References

  • Haller, H., & Krauss, S. (2002). Misinterpretations of significance: A problem students share with their teachers. Methods of Psychological Research, 7(1), 1–20. PDF
  • Gigerenzer, G. (1993). The Superego, the Ego, and the Id in Statistical Reasoning. Handbook for Data Analysis in the Behavioral Sciences. Hillsdale, NJ: Erlbaum.
  • Wasserstein, R. L., & Lazar, N. A. (2016). The ASA’s Statement on p-Values: Context, Process, and Purpose. The American Statistician, 70(2), 129–133.
$\endgroup$
19
  • 4
    $\begingroup$ This is an excellent, really well thought out answer (+1). For those interested, I have quite a few references at the end of the CV answer here if you want to dive into the history, misinterpretations, and rationale of $p$ values. $\endgroup$ Commented Nov 17 at 13:51
  • 1
    $\begingroup$ A very nice answer. Since it is also intended for non-technical audiences, perhaps it could benefit from examples to illustrate why some of the misinterpretations are wrong? For instance, for (2), the typical example is testing someone for a very rare disease and taking them not having the disease as your null hypothesis. Even if the probability of a positive test result given that they do not have the disease is only 1/100, if only one in a billion people has the disease, it is still much more likely that you got a false positive, so 1% is not the probability of the null hypothesis. $\endgroup$
    – Obie 2.0
    Commented Nov 18 at 12:09
  • 1
    $\begingroup$ For (1), I think the standard way is to talk about flipping coins and to point out that no matter how extreme the result, there is a chance that a fair coin flip could generate it. For (3), just point out that if they believe (1), it can't be correct. If you can't disprove the null hypothesis, you cannot prove the experimental hypothesis, since if doing so were possible, it would also disprove the null hypothesis. $\endgroup$
    – Obie 2.0
    Commented Nov 18 at 12:18
  • 2
    $\begingroup$ +1. Micro-nitpick: "the null hypothesis" here not only encompasses equality of means, but much more, which is usually not mentioned explicitly. For instance, to have a $t$ distribution, we also require equality of variances and normality of observations within each group, unless we want to rely on asymptotics. Once you have all this in mind, it's quite strange how $p<.05$ is always taken as evidence against equality of means only, when it could equally be taken as evidence against all the other (unspoken) assumptions. $\endgroup$ Commented Nov 18 at 12:26
  • 1
    $\begingroup$ Your thread is already winding its way through at least one psychology department... Re my comment, try comparing log-normally distributed populations with parameters $\mu_1=0, \sigma_1=2$ and $\mu_2=1.5, \sigma_2=1$: both have equal means of $\exp(2)$, but my simulations find that $P(p<.05)\approx .21$. And of course there are tons of papers on how susceptible various methods, like ANOVA, are against violations of all these "implicit" assumptions. $\endgroup$ Commented Nov 18 at 13:12
0
$\begingroup$

TLDR

Confidence/fiducial intervals and p-values are not a measure of evidence in the way that a Bayesian posterior is. However, they are used as such, in the sense that they aid in decision rules about deciding whether a certain observation is sufficient support for a particular hypothesis or not.

They do provide a method to create a criterium for hypothesis testing and interval estimates. Passing the criterium can be seen as proof. Not by the p-value by itself, but by the paradigm where a certain p-value/significance is chosen as a sufficient criterium.

Not the p-value, but the observation of t=2.7 is proof that the null hypothesis is false.

The p-value is like meta-data that describes our decision about the t=2.7 being proof or not.


  1. You have disproved the null hypothesis (that is, there is no difference between the population means).

That first statement is arguably correct. It is a bit semantical however.

Is a significant result 'disproving the null hypothesis' or is it 'demonstrating that the null hypothesis is false'? A lot of people accept the use of 'disproof'. For example RA Fisher in his 'The Design of Experiments' (section 8 'The Null Hypothesis').

In relation to any experiment we may speak of this hypothesis as the “null hypothesis”, and it should be noted that the null hypothesis is never proved or established, but is possibly disproved, in the course of experimentation.

(emphasis mine)

The bigger debate/misinterpretation is about the difference proving versus disproving (or accepting/rejecting) as in the 3rd statement.


Obie2.0 makes a good point in the comments by giving an example of a flimsy experiment

Suppose I roll a 20-sided die that I purchased at a game store, set my null hypothesis to be that the die is fair, such that p(20) = 1/20, and my alternative hypothesis to be that the die is weighted such that I am at least a little bit more likely to roll a 20. I set my significance level at 0.05, roll the die, and get a 20 (p = 0.05 under the null hypothesis).

With the single die roll it will probably not change much in the believes/probability about the null hypothesis being true or not

It is true that the p-value is not the same as the probability of the null hypothesis being true (the 2nd statement in the questionnaire).

Instead, it depends on the context what this exact probability is. For example, the previous believes about the hypothesis, the probability of obtaining a certain p-value given different hypotheses.

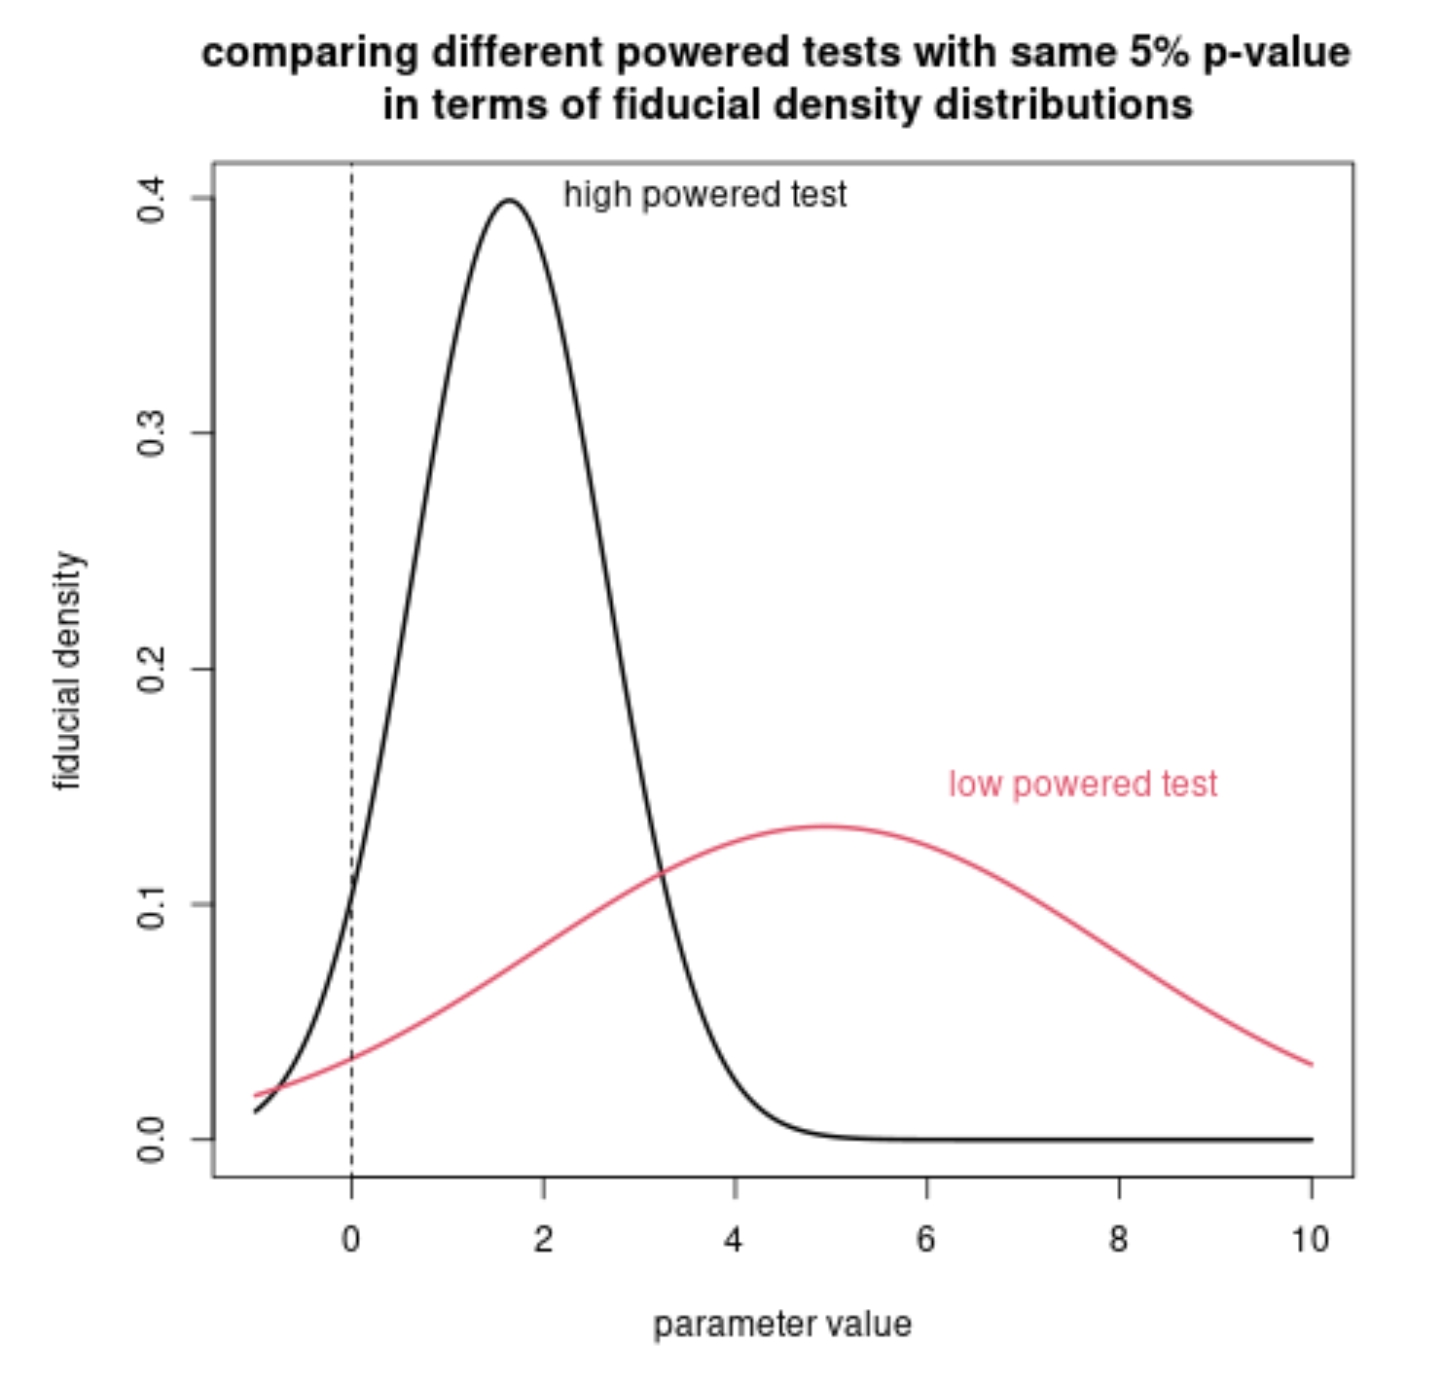
different fiducial densities with the same p-value

Considering all that and the differences in different powered tests, a low p-value does mean less plausibility that the null is true. Asking about the statement 'you have disproved the null', some information about the required significance level is left out but typically a p=0.01 result is considered as an acceptable level for disproving a null hypothesis.

And in a way, people also use low p-values as as proof in favour of the alternative hypothesis. A newsarticle headline like "scientists find new proof for ... " is only wrong when you scrutinize it based on an exact technical interpretation.

So you can also argue that 3 is correct.

  1. You have proved your experimental hypothesis (that there is a difference between the population means).

Interpreting 1 and 3 depends on the context that is being filled in by the person that makes the questionnaire. They do not imagine the dice roll example and consider instead their own practices.

It isn't 100% certain that the experimental hypothesis is correct, and you can not proof something with absolute certainty. But, in many experimental settings experimenters use a significance level as a criterium for considering proof of an effect. The proof might not be water tight, but it can be an acceptable proof. In time these criteria levels can change and different fields use different criteria: e.g. Origin of "5$\sigma$" threshold for accepting evidence in particle physics?

So if you ask practicing psychologists and statistics instructors such questions, then it is not weird to get some of those people to consider 'passing a certain significance level' as proof of an alternative or disprove of the null.

$\endgroup$
2
  • $\begingroup$ "Is a significant result 'disproving the null hypothesis' or is it 'demonstrating that the null hypothesis is false'?" Neither. Suppose I roll a 20-sided die that I purchased at a game store, set my null hypothesis to be that the die is fair, such that p(20) = 1/20, and my alternative hypothesis to be that the die is weighted such that I am at least a little bit more likely to roll a 20. I set my significance level at 0.05, roll the die, and get a 20 (p = 0.05 under the null hypothesis). Do you believe that the null hypothesis has been falsified? Has it been disproved? $\endgroup$
    – Obie 2.0
    Commented Nov 22 at 8:30
  • $\begingroup$ @Obie2.0 It is correct that a p-value on it's own is not the same as a measure of proof or plausibility. But in many contexts the p-value has evolved into an acceptable criterium for a desired level above or below which an experiment is regarded as a sufficient proof. $\endgroup$ Commented Nov 22 at 9:57

Not the answer you're looking for? Browse other questions tagged or ask your own question.