4
$\begingroup$

I have a dataset with multi class for classification. After train and test, tried to plot with confusion matrix. And I found it really different with dataset with simple label true false or yes no. So I don't know how to read this kind confusion matrix.

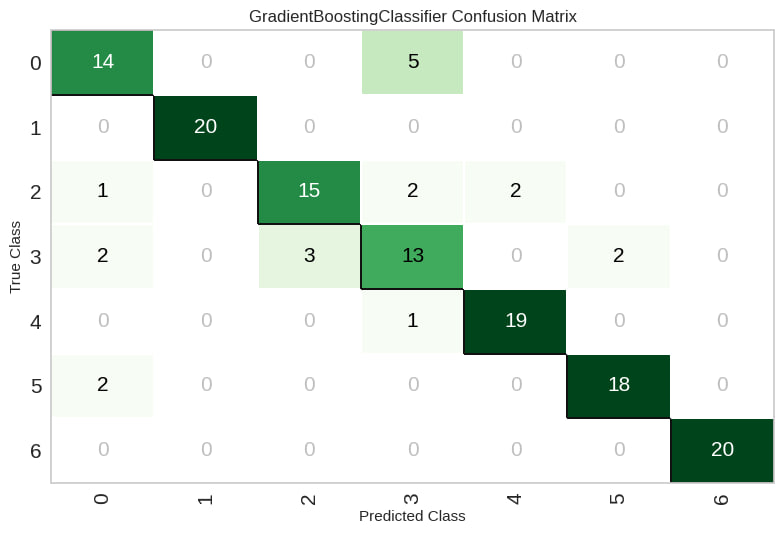
This is my confusion matrix

multiclass confusion matrix

As we can see from this matrix, I Can not understand which one:

  1. True Positive
  2. False Positive
  3. True Negative
  4. False Negative

as we can see again, I have 7 labels.

Please help me understand how to read and analyze this kind confusion matrix (multi class confusion matrix)

Thanks

$\endgroup$

2 Answers 2

4
$\begingroup$

For each element in the test set, we know its actual class (true class) and the class our classifier predicts (predicted class).

In a binary classification problem, we have only two classes: positive and negative. However, in a multiclass confusion matrix, we no longer have "positive" and "negative" classes, so it does not make sense to use those concepts here.

In a multiclass confusion matrix, the concept of "positive" and "negative" classes from binary classification is replaced with the individual classes of the problem.

Instead, in a multiclass confusion matrix, we count the class each element is predicted to belong to (columns) depending on its true class (rows). This way, in the diagonal, you find the elements that were correctly classified (predicted class matches true class) while in the non-diagonal elements, you see the number of misclassified elements. The higher the counts in the diagonal, the better your classifier is. If we look at the columns, we can see, for each predicted class, what the actual true classes were. If we look at the rows, we can see, for each true class, what the predicted classes were.

In the matrix, we can quickly see if we are consistently misclassifying one class for another one. For instance, in your matrix, we can see that class 0 is sometimes (5 times) misclassified as class 3. If the problem were worse, we might decide to try to get more data from these classes to train a better classifier.

$\endgroup$
2
$\begingroup$

The metrics you talk are better understood for a two-class problem, they can still be used for more than 2 classes, let's see how checking values of precision and recall for a given class.

Precision for class 3

Let's say we want to know how well the ML model is doing for class 3 (the forth class in your image), since we have more than 2 classes I have to evaluate how the model classifies samples for this class vs. all the other classes.

Let's take class 3, the model sees 21 samples (we count the values on the column: 5+2+13+1=21). 13 of those samples are correctly predicted (they are on the matrix diagonal), 8 are not (they are spread on multiple other classes), so the precision (PPV) (wiki: sensitivity vs. specificity) for class 3 is 13/(13+8) = 0.62; in this case 13 are TP (true positives) and 8 are FP (false positives: note that our model gives them class 3 but those 8 values are spread on the other classes).

Recall (sensitivity) for class 3

For the same class 3 we know there are, in my dataset, 20 samples (here I count the row values: 2+3+13+2=20); with this in mind you can get the recall (TPR) for class 3: TP/(TP+FN) = 13/(13+7) = 0.65, where 13 is still TP, and 7 is FN (false negatives: note that we know they belong to class 3 but have been misclassified by our model).

You can get the remaining values knowing that N=TN+FP (negatives) and P=TP+FN (positives).

Metrics for confusion matrix

If you check and example of classification with multiple classes you will notice the use of macro average and weighted average (scikit-learn: Label Propagation digits active learning). Those are useful to interpret how good your model is globally on every class.

$\endgroup$

Your Answer

By clicking “Post Your Answer”, you agree to our terms of service and acknowledge you have read our privacy policy.

Not the answer you're looking for? Browse other questions tagged or ask your own question.