0
$\begingroup$

I am new to the community and data science. I have found this hub to be of extreme value and hope to be an additive contributor one day.

VS Code: Python: Pandas Question

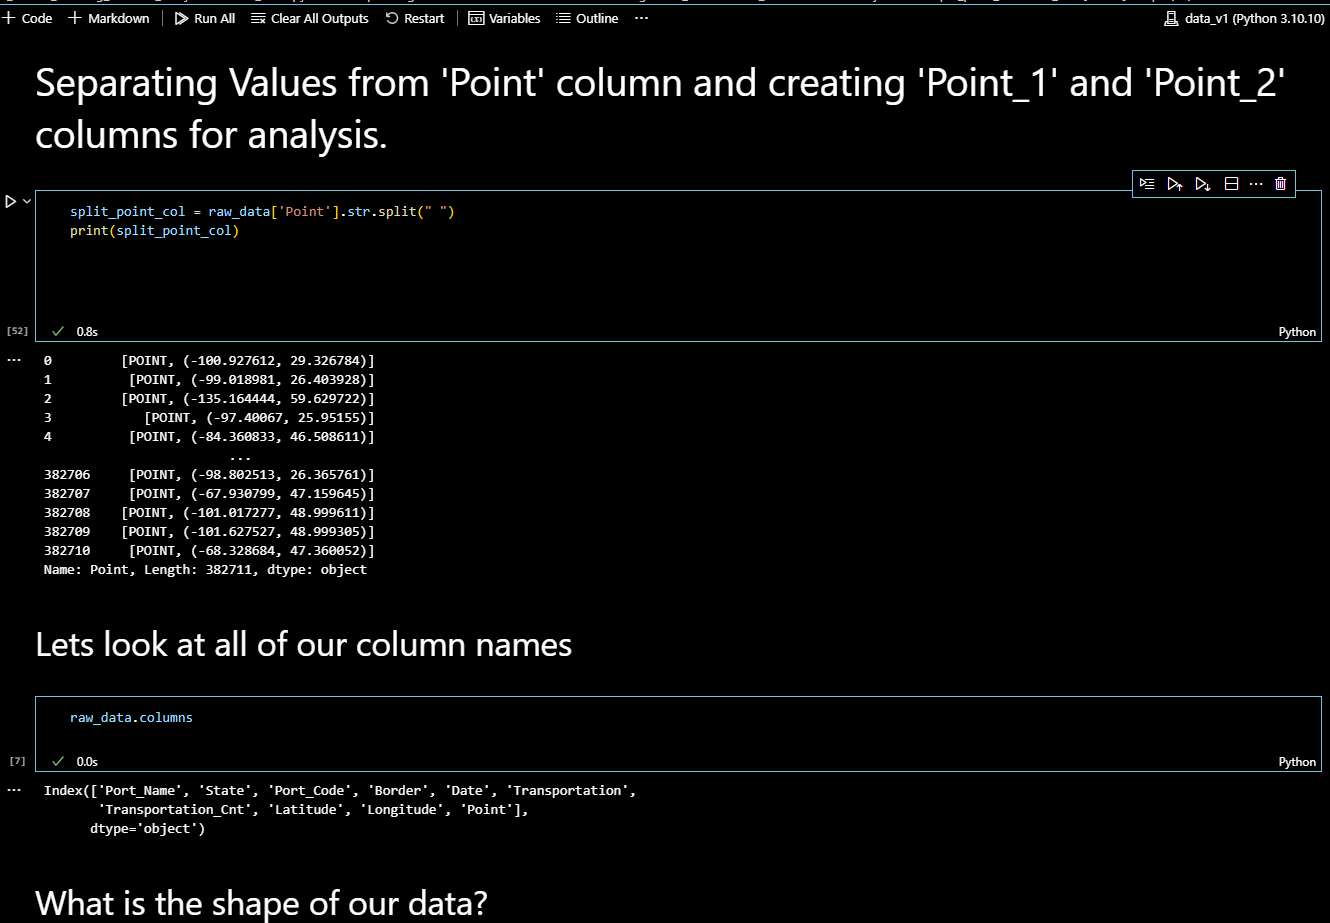
I am working with a data set in VS code utilizing python. Currently I am cleaning this data set up and I am trying to parse 2 values from a list of 3 item for every column in a series.

This column of the dataframe was originally a string and I need to convert it to a numeric data type. So far I have split the values in the column and created a list within each row of this column.

How do I create 2 new columns with just the numeric values from this series where all of the values are lists in a python dataframe?

I would like to create columns 'Point_1' and 'Point_2' from the numeric values using a for loop. what is the best way to do this?

Below is an image of my IDE with the code snippet.

enter image description here

$\endgroup$

1 Answer 1

1
$\begingroup$

One way to go from a column with a list/tuple of values to multiple columns is to transform each row in your dataframe into a row with multiple values and then stack those new rows vertically. The apply() method of the original dataframe does both of these operations:

split_point_col.apply(lambda x: pd.Series(x[0]),
                      axis = 1)

When you do apply() with axis=1, the lambda function you supply is called for each row in the original dataframe. So the variable x in the lambda is going to be one row from the dataframe for every call.

The rows of a dataframe are Pandas.Series objects so they have a row index, and a tuple of associated values. Each row is passed with an index of 0 so the easiest way to access the values from the row is to grab the values at index 0 with x[0].

The values (a single tuple) can then be passed to pd.Series() that generates a series object from the tuple, inserting each of the three elements of the tuple at indices 0, 1 and 2.

After the lambda has been invoked, the new Series object will be stacked on top of each other and become a dataframe. This happens automatically with apply.

Note that this will create three columns per row the first one will just have the string 'Point' in it. Since you only want two columns for the coordinates, you can use pd.Series(x[0][1:]) instead.

$\endgroup$
1
  • $\begingroup$ Thank you so much you have been a huge help!! $\endgroup$ Commented Aug 1, 2023 at 3:10

Your Answer

By clicking “Post Your Answer”, you agree to our terms of service and acknowledge you have read our privacy policy.

Not the answer you're looking for? Browse other questions tagged or ask your own question.