2
$\begingroup$

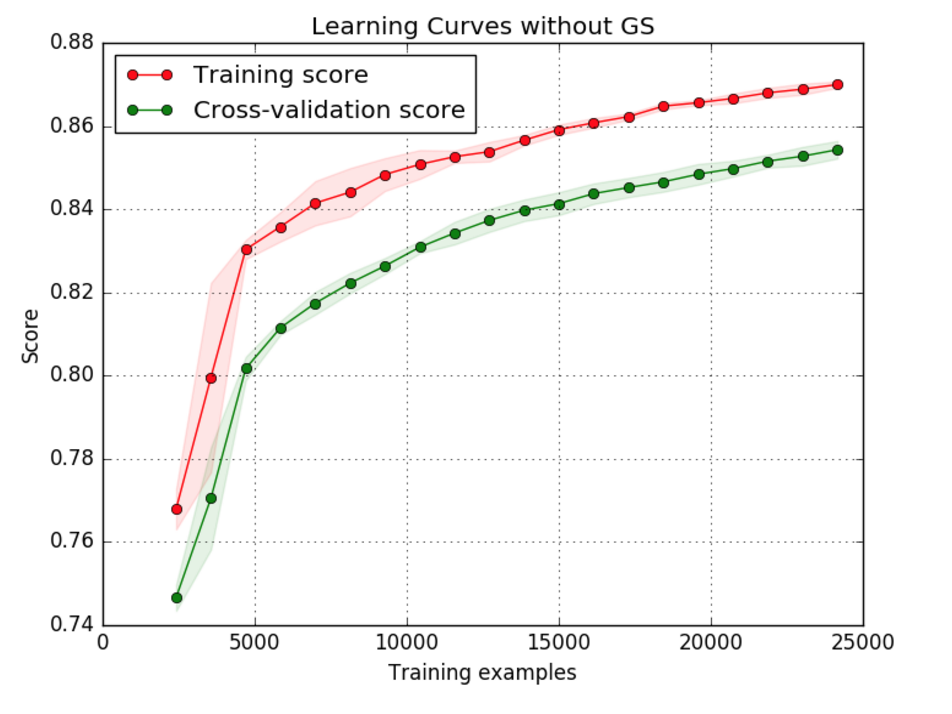
In continuation with a question already asked, I tried the same curve on a different dataset I found. My model is a simple Logistic regression curve with OnevsRest Classifier. But the graph I obtained this time was different. enter image description here

What could be a possible reason for this? As explained in the other answer, if it takes less data to fit better, shouldn't the accuracy decrease here as well?

$\endgroup$
4
  • $\begingroup$ I think this is unusual. I have a suspection though - could you try to randomly shuffle your data (X and y) and check if you're still getting the same learning curve when you use the shuffled data? $\endgroup$
    – stmax
    Commented Sep 27, 2016 at 8:41
  • $\begingroup$ I used sklearn's learning_curve to do this. sklearn does actually randomly shuffle internally while plotting this curve. $\endgroup$ Commented Sep 27, 2016 at 8:51
  • $\begingroup$ PS.: with shuffling X and y I don't mean to use KFold(..., shuffle=True), but something like permutation = np.random.permutation(len(X)), X = X[permutation], y = y[permutation]. Let me know if that changes your learning curve. $\endgroup$
    – stmax
    Commented Sep 27, 2016 at 8:52
  • 1
    $\begingroup$ I don't think it does - I get very different results when I shuffle or not. Please try shuffling it yourself with np.random.permutation as explained above. $\endgroup$
    – stmax
    Commented Sep 27, 2016 at 8:53

1 Answer 1

1
$\begingroup$

These learning curves seem unusual - the training accuracy should start high and get lower as more samples are added.

I suspect that your data is sequential (it has some kind of time dependency). sklearn's learning_curve function does not seem to shuffle the data (should it?), so the training accuracy can change/increase once new structures appear in the data over time.

Here's a notebook trying to reproduce the effect: https://gist.github.com/stmax82/79b744877b0a482f8739d372c4777e0d

Two images from the notebook:

The learning curves on the shuffled data look like that (as expected):
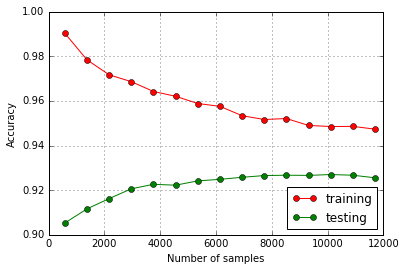
learning curves on shuffled data

While the learning curves on the original / sequential data look like that (unusual because training accuracy is rising over time):
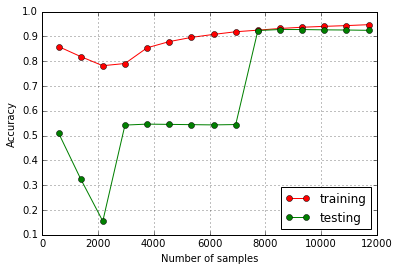
learning curves on original data

That's just my try at explaining your learning curves. It might be something completely different... try shuffling your data to find out.
$\endgroup$
3
  • $\begingroup$ I shuffled the dataset and tried it again as you suggested. It seems to follow the same trend. $\endgroup$ Commented Sep 29, 2016 at 12:59
  • $\begingroup$ Alright. I guess we need a new hypothesis then :p $\endgroup$
    – stmax
    Commented Sep 29, 2016 at 15:05
  • $\begingroup$ It may be useful to have a pointer to the data $\endgroup$
    – Pablo Suau
    Commented Sep 30, 2016 at 12:38

Your Answer

By clicking “Post Your Answer”, you agree to our terms of service and acknowledge you have read our privacy policy.

Not the answer you're looking for? Browse other questions tagged or ask your own question.