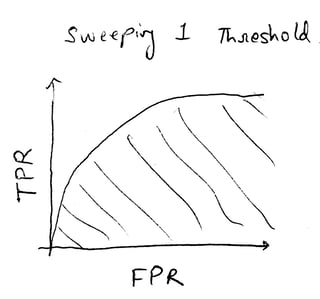
The image on the left shows a standard ROC curve formed by sweeping a single threshold and recording the corresponding True Positive Rate (TPR) and False Positive Rate (FPR).
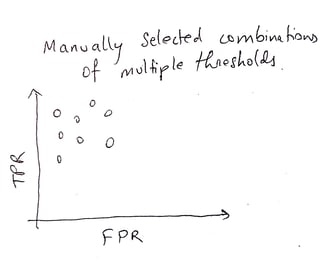
The image on the right shows my problem setup where there are 3 parameters, and for each, we have only 2 choices. Together, it produces 8 points as depicted on the graph. In practice, I intend to have thousands of possible combinations of 100s of parameters, but the concept remains the same in this down-scaled case.
I intend to find 2 things here:
- Determine the optimum parameter(s) for the given data
- Provide an overall performance score for all combinations of parameters
In the case of the ROC curve on the left, this is done easily using the following methods:
- Optimal parameter: Maximal difference of TPR and FPR with a cost component (I believe it is called the J-statistic?)
- Overall performance: Area under the curve (the shaded portion in the graph)
However, for my case in the image on the right, I do not know if the methods I have chosen are the standard principled methods that are normally used.
Optimal parameter set: Same maximal difference of TPR and FPR
Parameter score = TPR - FPR * cost_ratio
Overall performance: Average of all "parameter scores"
I have found a lot of reference material for the ROC curve with a single threshold and while there are other techniques available to determine the performance, the ones mentioned in this question is definitely considered a standard approach. I found no such reading material for the scenario presented on the right.
Bottomline, the question here is two-fold: (1) Provide methods to evaluate the optimal parameter set and overall performance in my problem scenario, (2) Provide reference that claims the suggested methods to be a standard approach for the given scenario.


