8
$\begingroup$

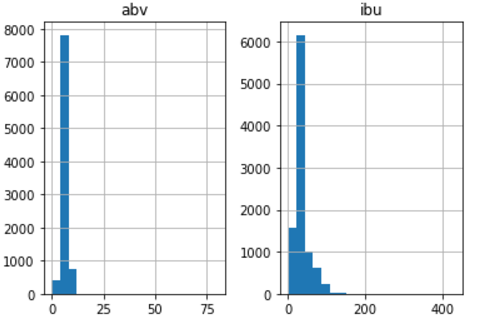
I'm doing some exploratory data analysis on some data and I get these histograms:

enter image description here

That looks like a candidate for a log transformation on the data, so I run the following Python code to transform the data:

df["abv"].apply(np.log).hist()
df["ibu"].apply(np.log).hist()
plt.show()

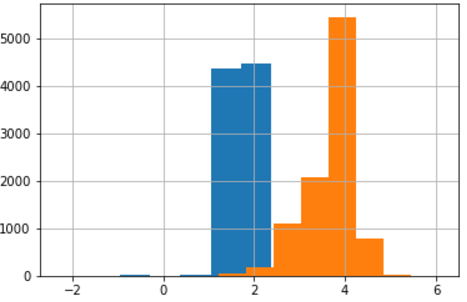
And I get this new plot of the transformed histograms:

enter image description here

Am I correct that a log transform was ok to do in this case, and if so, what's the best way to interpret the results?

$\endgroup$
1
  • 6
    $\begingroup$ Try calling hist(logx=True) instead. $\endgroup$
    – Emre
    Commented Sep 11, 2017 at 18:11

1 Answer 1

5
$\begingroup$

Yes, log transform seems a good solution for better interpretation. Overlap between these two datasets is really small, so, only by looking at the plot, you can say with high certainty, that they are significantly different from each-other.

$\endgroup$
1
  • 1
    $\begingroup$ Between this and what @Emre mentioned, it got me on the right track! $\endgroup$
    – Jon
    Commented Sep 18, 2017 at 23:44

Your Answer

By clicking “Post Your Answer”, you agree to our terms of service and acknowledge you have read our privacy policy.

Not the answer you're looking for? Browse other questions tagged or ask your own question.