I have been working on data science project where I am trying to build a metric for how inbred a source is in a network. We hope to apply this to intelligence reporting, in which documents tend to cite other sources without the knowledge of an inherent bias. Think WBD Iraq, where a small footnote in a single intelligence report led to second and third order effects that allowed the piece of information to gain more ground then it should—it created an echo chamber.
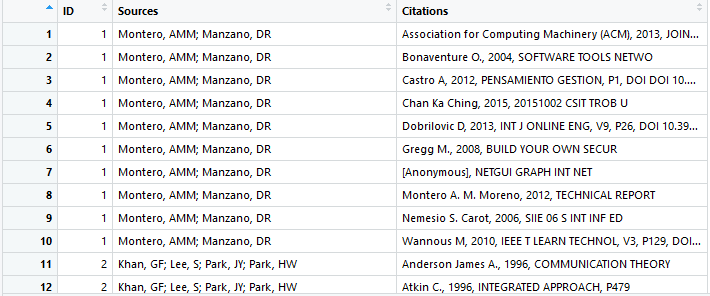
Before applying this to intelligence reporting, we decided to use a citation network to demonstrate capability. We took the first 200 sources, sorted by relevance, using the keyword “network science.” Then we built two edge list: First, we built a source edge list that has an “ID” column and a column with the source name. Second, we built a citation edge list that has an “ID” column and a column with each sources citations. So, we have list of 200 sources and about 5,000 citations.
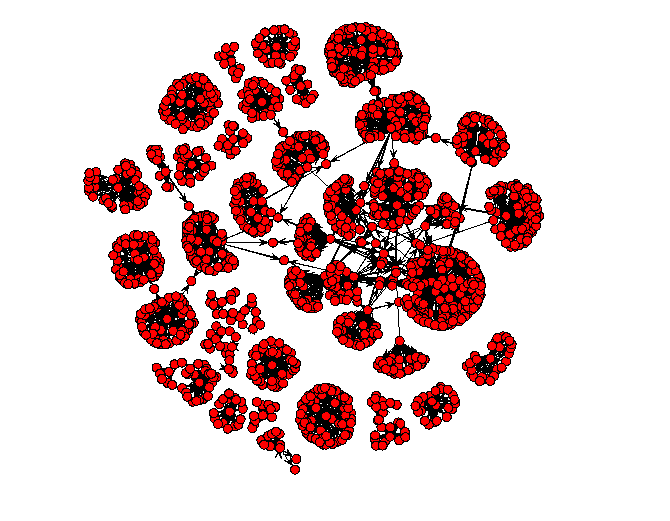
Our code merges the data set so that each source has each of its citations with the correct ID, and we plot it. However, we are trying to get it to plot as a DAG. In our pseudocode, we have tried this twice unsuccessful. We plan to do transitive reduction after we can make a DAG to get at our point of a metric of the echo effect.
Two Questions:
1) Did we merge the data correctly or should we do more on the front end?
2) We need to work on how to plot a DAG and how we can perform transitive reduction.
# Reading the Data into R
cit.citations <- read.csv(file.choose())
cit.sources <- read.csv(file.choose())

# Merge the Data Frames
cit.total <- merge(cit.sources, cit.citations, by="ID")

# List all the sources
sources.vertices <- cit.total$Sources
sources <- (as.character(sources.vertices))

citation.edges <- cit.total$Citations
citations <- (as.character(citation.edges))

total <- rbind(sources,citations)

# Redefining the Data Frame into a Network Object
net.cit.obj <- graph_from_data_frame(d = cit.total, directed=TRUE)

# Network - using dplyr package
cit.test <- dplyr::inner_join(cit.sources,cit.citations, by = "ID")[,-2]
cit.test.network <- as.network(cit.test, directed = TRUE, loops = FALSE)
as.sociomatrix(cit.test.network)
as.edgelist(cit.test.network)
plot(cit.test.network)


