I am trying to detect outliers in my data-set with 5000 observations and 800 features. I have followed the simple steps told in http://scikit-learn.org/stable/auto_examples/ensemble/plot_isolation_forest.html
There are some examples in stackoverflow and other sources as well, however, I could not find a decent explanation about the interpretation of outliers returned by isolationforest. First, what I did is:
from sklearn.ensemble import IsolationForest

X_train = trbb[check_cols]

clf = IsolationForest(n_jobs=6,n_estimators=500, max_samples=256, random_state=23)
clf.fit(X_train)
y_pred_train = clf.predict(X_train)
y_pred_train
This returns array([1, 1, 1, ..., 1, 1, 1]) where -1's are the outliers.
The shape of y_pred_train is 5000, which is identical with X_train[0]. So the index of -1 corresponds to the index of X_train. For exp. one of the outlier indices returned by IF is 532. So this means that the point (in 800 dimensional space) in this index is detected as an outlier. After detecting this, how can I approach and use the results to dig more? For example, can I reach the most important features causing the outliers?
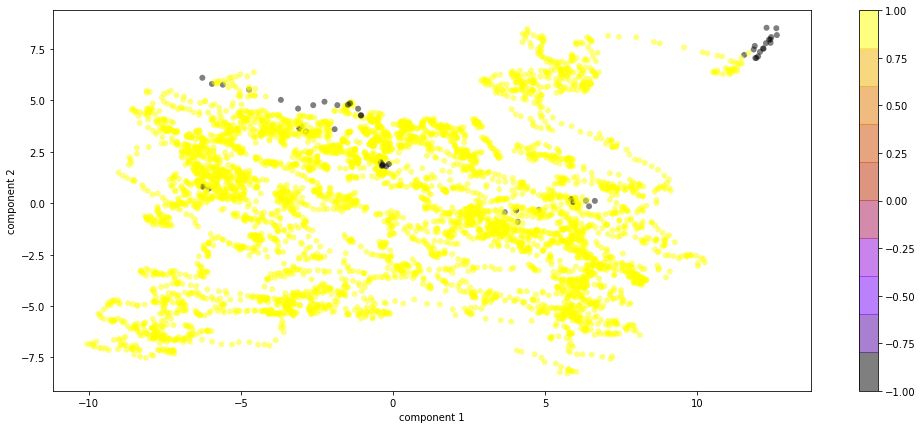
To this end, I applied PCA and used the newly created (50) components as new variables. Then, by plotting component pairs with -1 & 1s returned by IF, I tried to get some insight of possible outliers. Indeed, I observed some points as shown below:
Here, the black dots are -1s (outliers) and the yellow ones are 1s (inliers). I interpret this that if both components have very high values, it might cause an outlier. However, how can I decide which original values are the most effective ones for those outliers? For example, can I use the original variables with the highest weights (let's pick top 10) in the related components? Or could you suggest any other method?
Thanks in advance!

