2
$\begingroup$

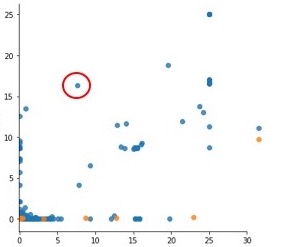
I have a scatter plot with about 19,000 data points. By visual inspection, I noticed some points for which I want to look at the corresponding numerical data from the data frame (basically a subset of the original data whose scatter plot we are looking at).

Is there a way to isolate the data corresponding to the point(s) [when the coordinates of the data points are not apparent from the figure] ?

Below is an example. How do I get data corresponding to the circled point on the plot?

enter image description here

Any response would be of great help.

Thanks.

$\endgroup$
2
  • 1
    $\begingroup$ How about interactive access to points? stackoverflow.com/questions/10655217/… It is easier than bokeh/ plotly, and if combined with annotate mentioned below you get your points of interest. $\endgroup$ Commented Dec 19, 2018 at 7:01
  • $\begingroup$ Okay..this is interesting....thanks for sharing @MajidMortazavi. $\endgroup$
    – user62198
    Commented Dec 19, 2018 at 16:16

1 Answer 1

2
$\begingroup$

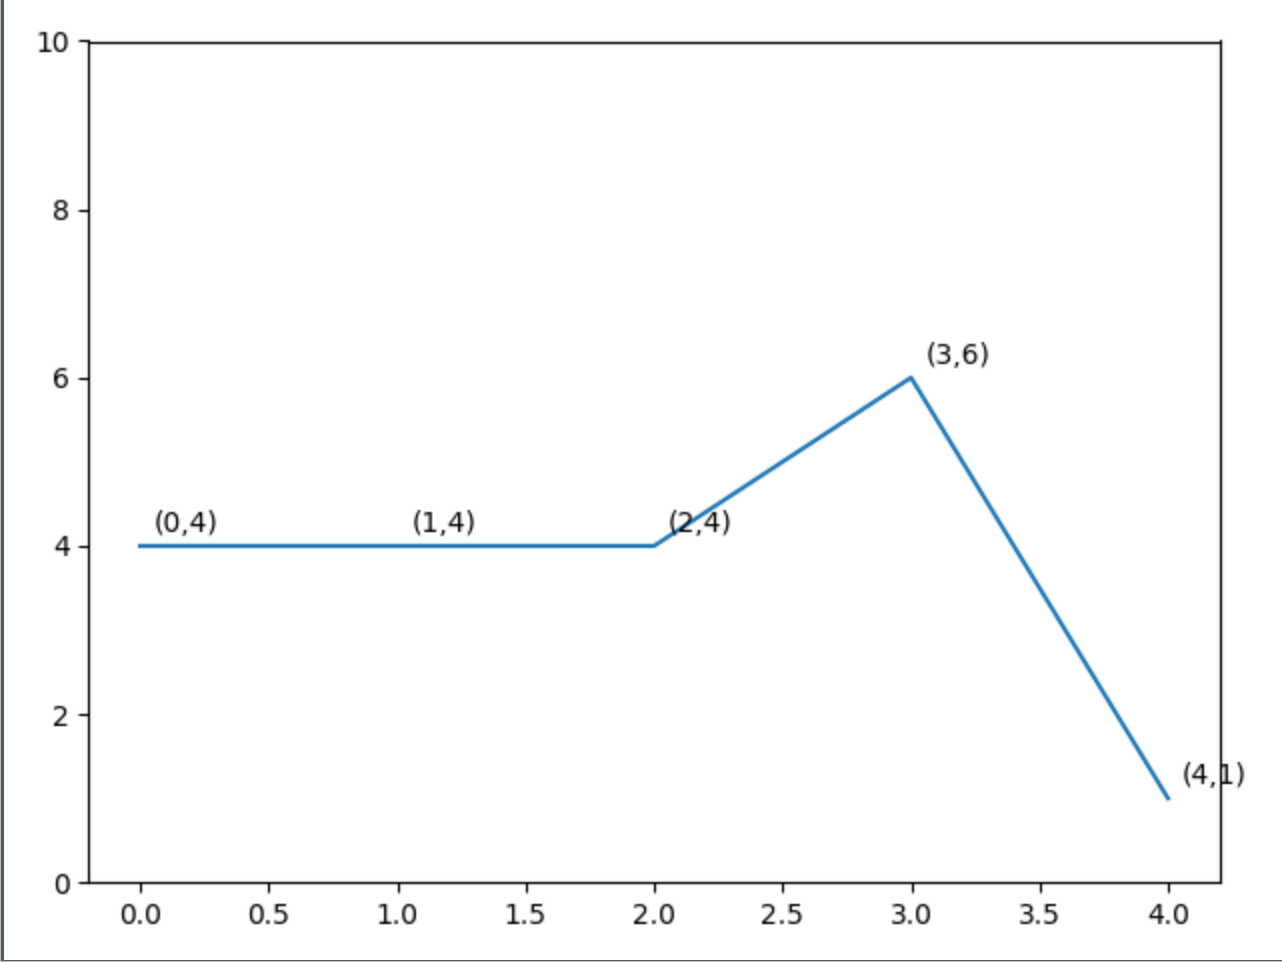
You could also show the values for each point by using matplotlibs annotate command:

import numpy as np
import matplotlib.pyplot as plt

x = np.arange(5)
y = np.random.randint(10, size=5)

fig = plt.figure()
ax = fig.add_subplot(111)
ax.set_ylim(0,10)
plt.plot(x,y)
for i,j in zip(x,y):
    # xytext and textcoords are used to offset the labels
    ax.annotate("({},{})".format(i, j), xy=(i, j), xytext=(5, 5), textcoords='offset')
plt.show()

Annotated graph

$\endgroup$
3
  • $\begingroup$ Although helpful for small number of points, this may become unwieldy when there a lot of points involve. Having said that, I can't think of any other way to do it except may be using some fancy bokeh/ plotly type packages. $\endgroup$
    – user62198
    Commented Dec 19, 2018 at 6:38
  • 1
    $\begingroup$ What you could do is an outlier detection: Add another value to x,y to determine if the point is an outlier and then only annotate the point if it is. $\endgroup$
    – oezguensi
    Commented Dec 19, 2018 at 14:47
  • 1
    $\begingroup$ I was thinking of annotating the points with index values instead of (x,y) coordinates, but your solution is better. $\endgroup$
    – user62198
    Commented Dec 19, 2018 at 16:13

Your Answer

By clicking “Post Your Answer”, you agree to our terms of service and acknowledge you have read our privacy policy.

Not the answer you're looking for? Browse other questions tagged or ask your own question.