I'm currently trying to visualize a large data set as heat map. That in itself works smoothly but I struggle with gaining insights from interestingly looking clusters.
Specifically, I have two questions that are very related:
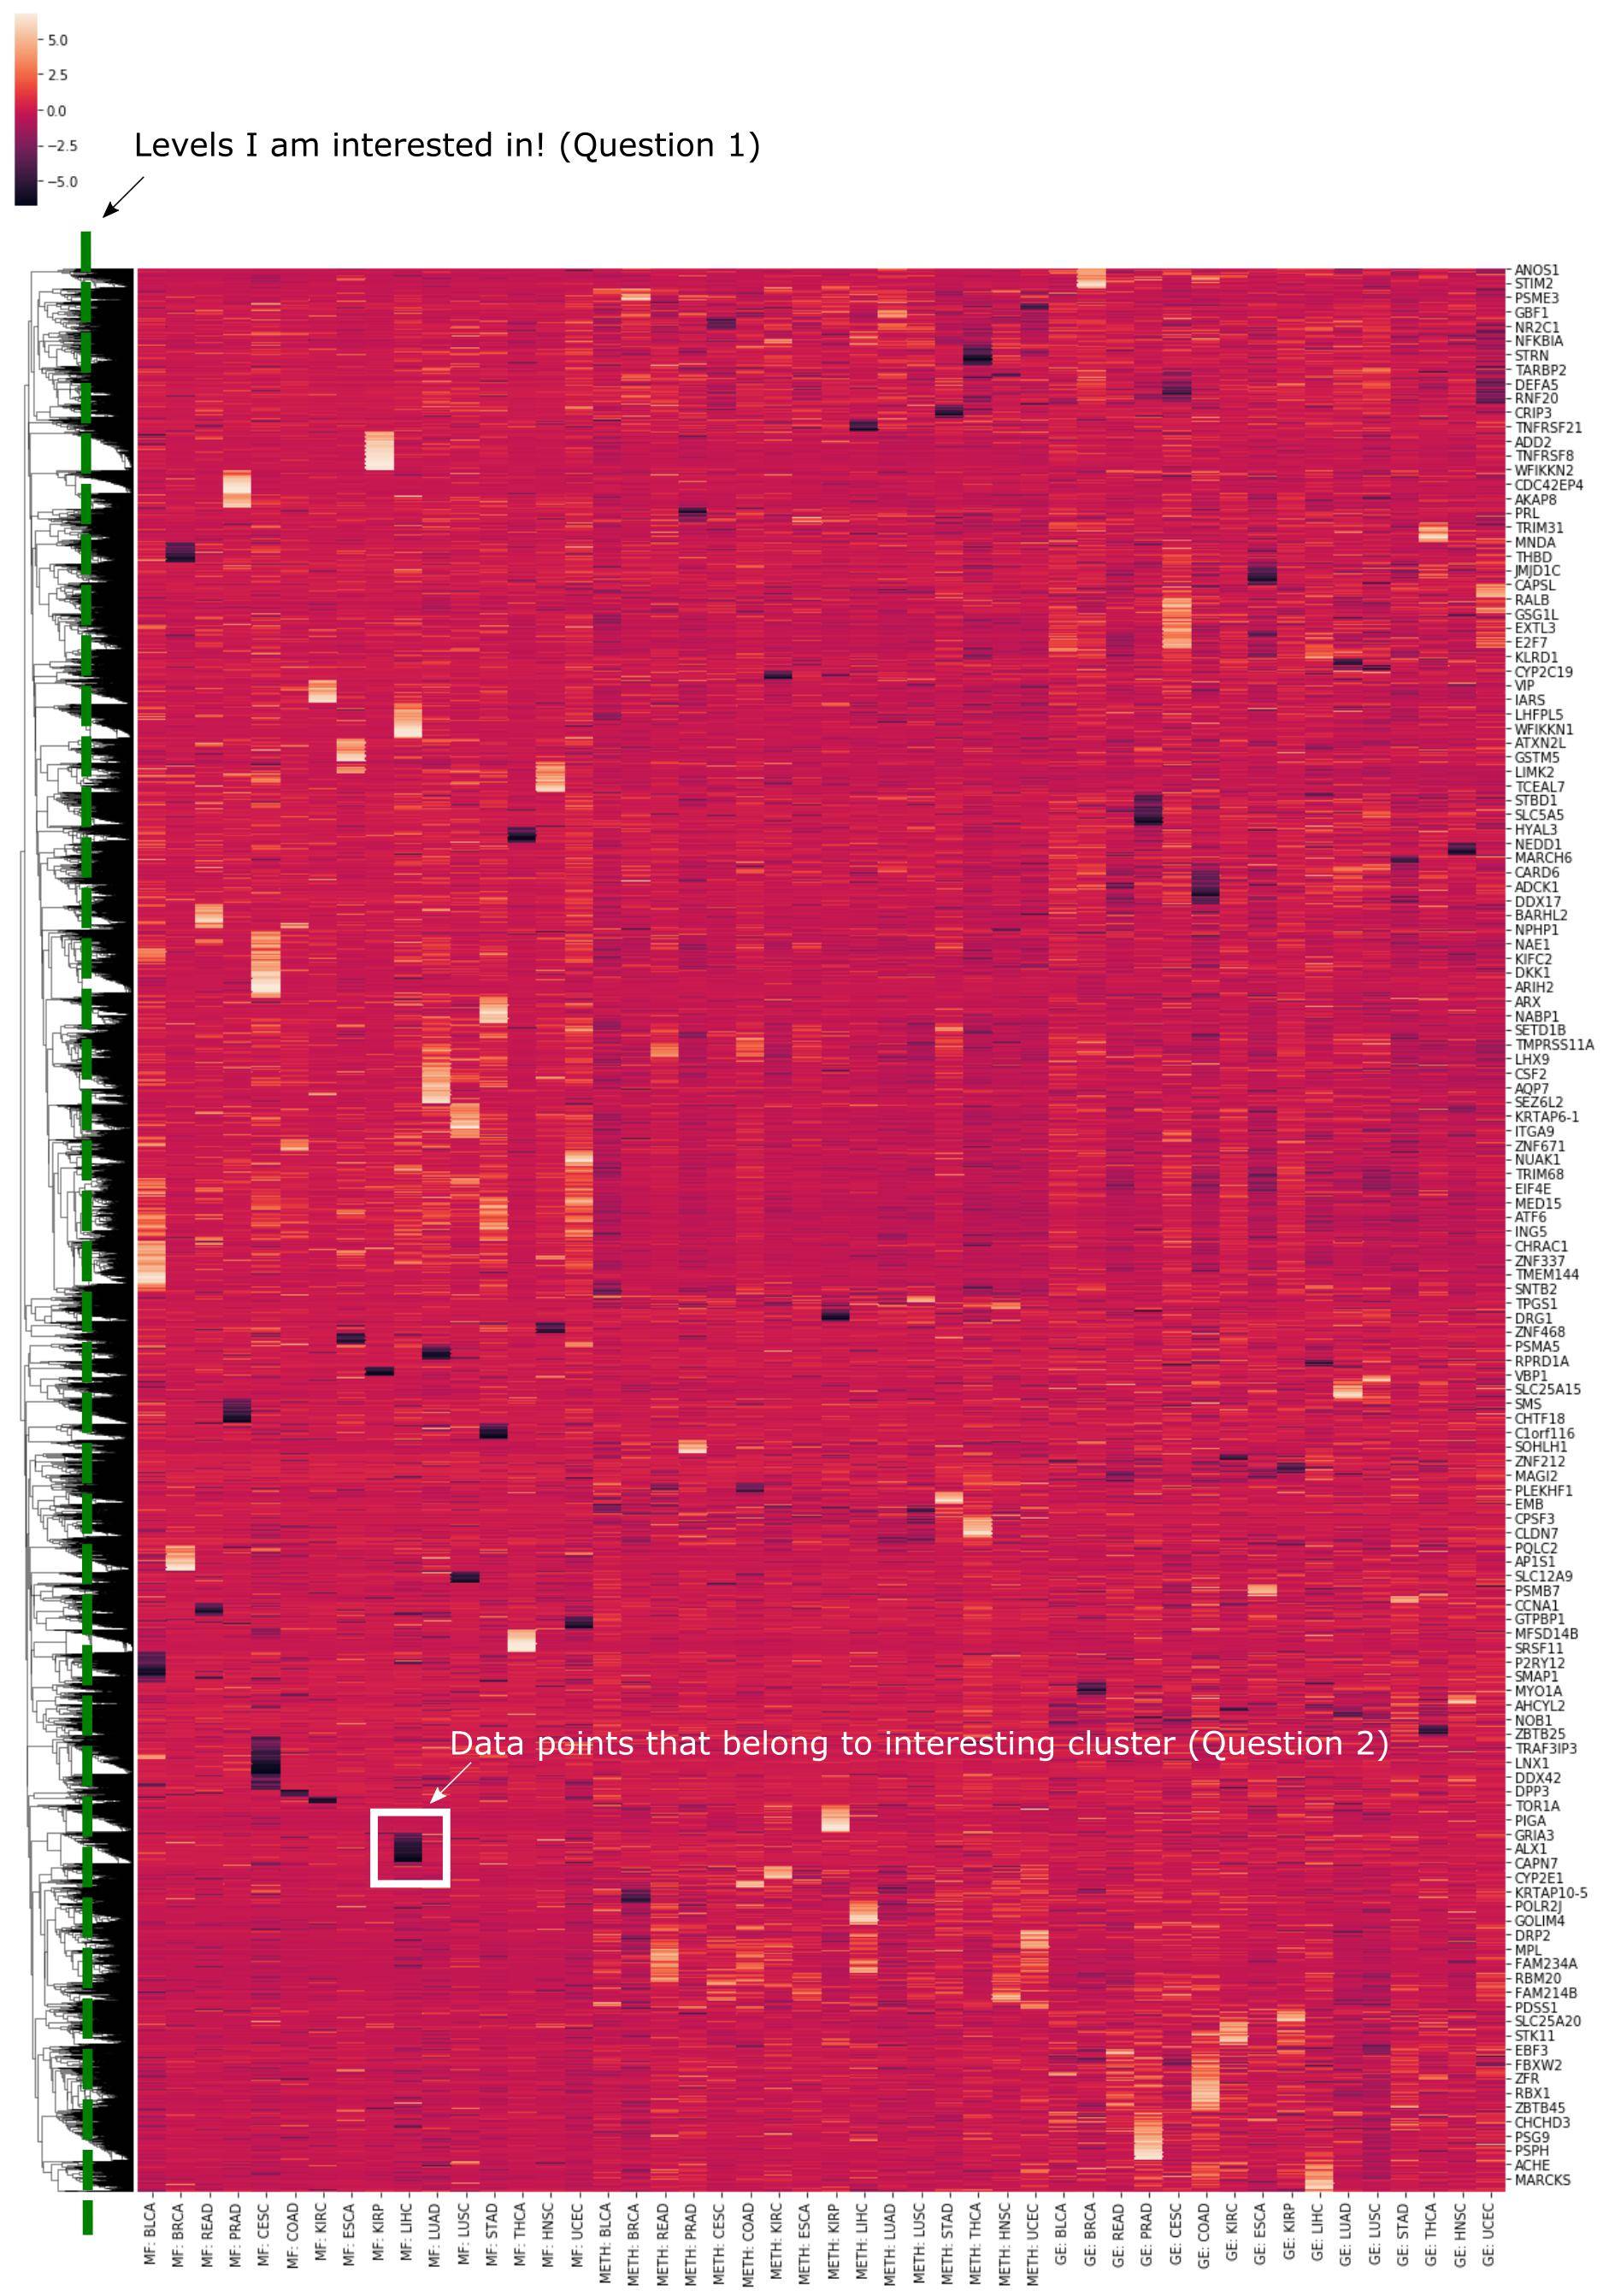
First, I find clusters of interesting features and am looking for a systematic way to extract the a flat clustering at a specific level (but the fcluster function seems to do something different and cut_tree doesn't work with those trees). I would like to have a slice of the hierarchical clustering at a specified depth of the dendrogram. This is probably encoded in the linkage matrix Z but I struggle to understand how exactly I can extract that information from Z.
Second, with the complicated heatmap pictured below, the row names on the right are gene names for every 100th data point (gene). I would now like to have a look at which genes are in some of the little clusters, for instance the little black square for feature MF: LIHC that is marked.
 I know the IDs of the genes that are labelled on the right, so I would want to know something like:
Which genes are in the same cluster as CAPN7 at level 5?
Thank you for your help!
Roman


