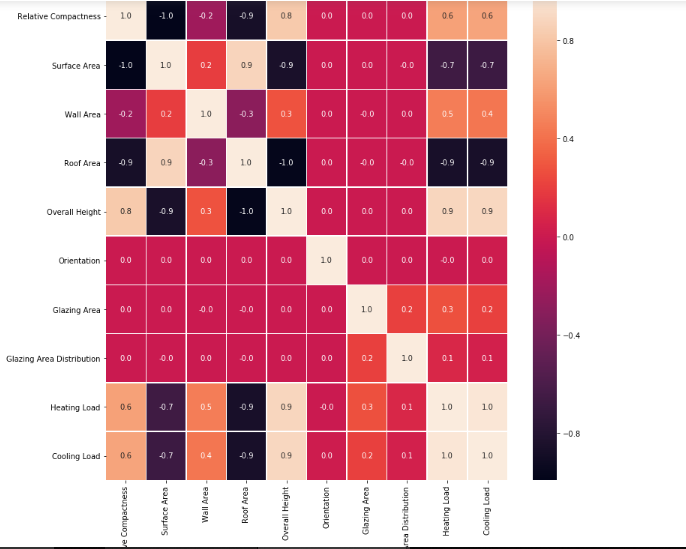
I have constructed a Heatmap of my dataset for visualization. I have searched on various sites regarding what can I infer from the heatmap and I am unable to get any clear understanding from them. I want to select useful features for Exploratory Data Analysis and Visualization to get some insights. If you can provide any suggestion or advice it would be extremely helpful for me. Thank you
1 Answer
Assuming you're using df.corr(), the results from a heatmap are Pearson correlation coefficients which can be thought of as "the explainability between two arrays."
An effect score closer to 0 translates to there being no relationship. A score closer to 1 or -1 is a positive or negative relationship. A perfect score of 1 is a direct correlation.
Additionally, I would caution against taking action using these values without testing the normalcy/distribution of your data.
