3
$\begingroup$

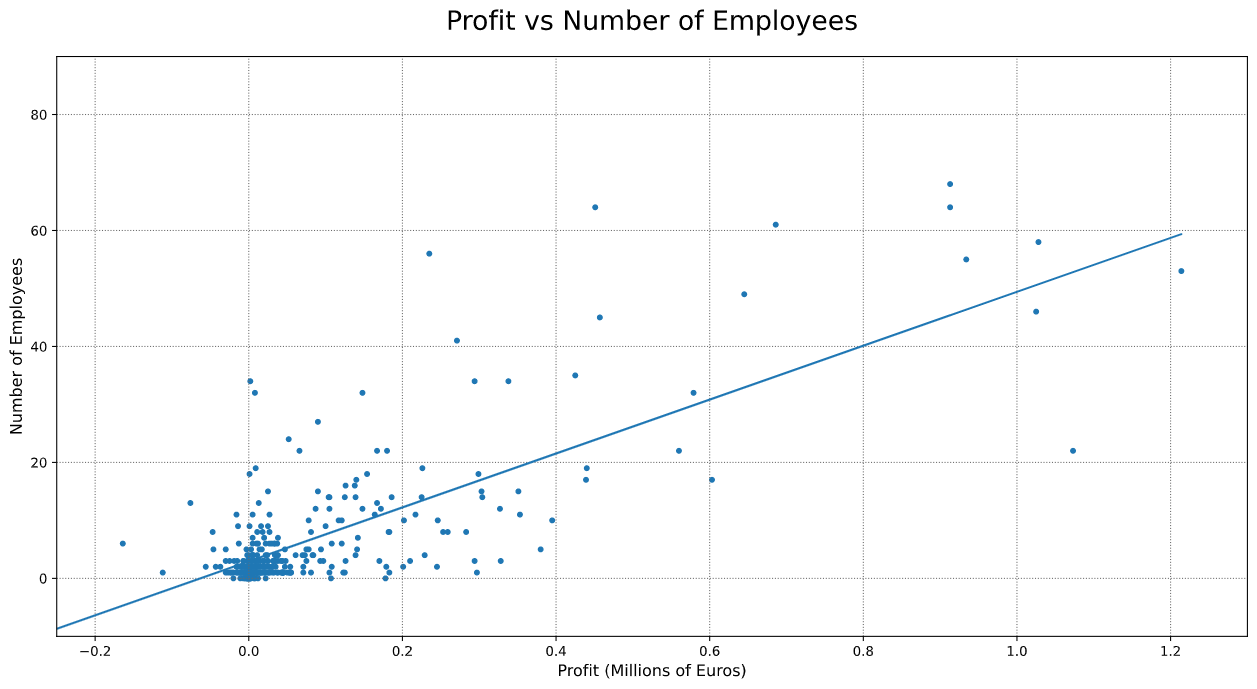
I am trying to compare companies in the same industry and see how Profit and Number of employees correlated. My linear regression looks something like this:

enter image description here

Given the nature of the dataset, the model describes offices with low-profit better than the offices with a high profit. This is understandable since there are fewer samples for very profitable offices and a lot of samples for less profitable offices.

However, when I check for the residuals I get something like this:
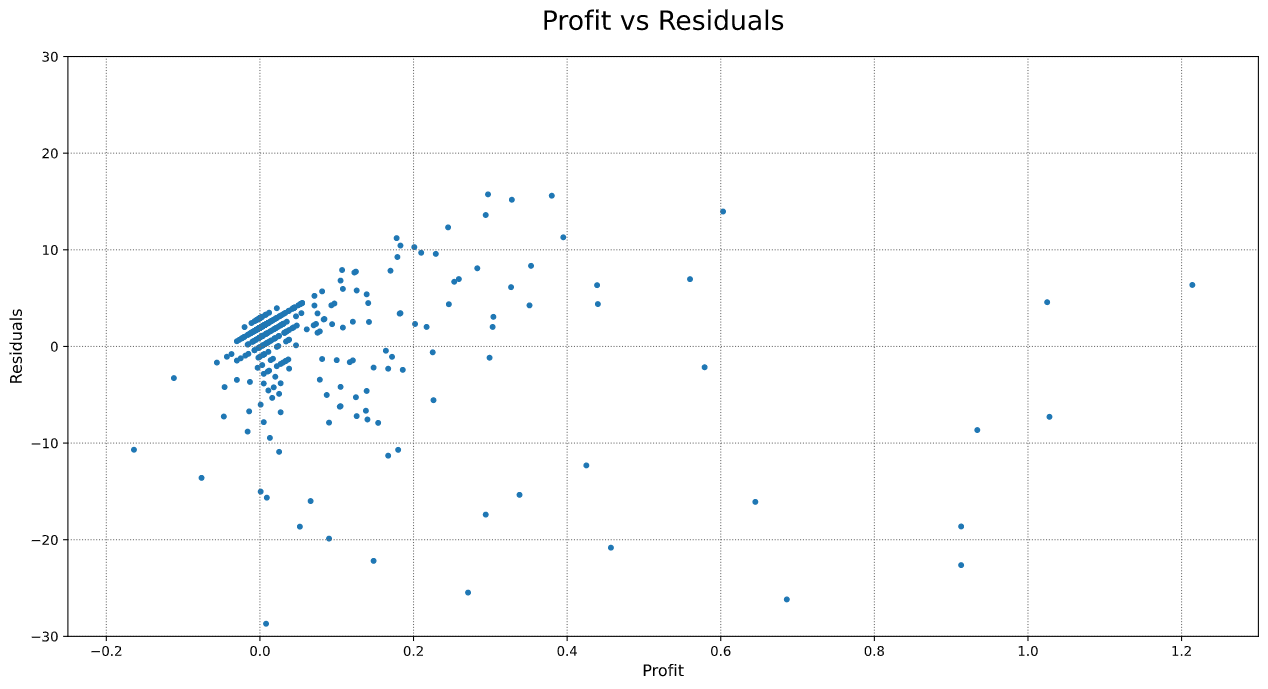
enter image description here The graphs show linear patterns for offices with lower profits. I am not certain how to interpret these trends.

Question: What do linear trends in residuals indicate? How can the model be adjusted to handle them?

$\endgroup$

2 Answers 2

2
$\begingroup$

When I see it correctly in the top figure, there is some " bunching" in your data, meaning that there are a number of companies with the same (or very similar) number of employees. Since you appear to run a regression with only one independent variable (right hand side), this bunching will be visible in the residual.

Your model is:

$$ y_i = \beta_0 + \beta_1 x_i + u_i$$

Now say $\beta_0 = 1$ and $\beta_1 = 0.1$, and with "bunching" in $y$ you will get something like:

y     x      y_hat  u_hat
--------------------------
5     10     2      3
5     20     3      2
5     30     4      1
5     40     5      0

So the linear nature of the model will be reflected in the residual given that there is "bunching" in the data.

Note that using a log-log approach (which is perfectly okay) will change the natural interpretation of the estimated coefficients. In a log-log case, you will interprete the results as "a one percent change in $x$ will be associated with a $\beta_1$ percent change in $y$" (all other things equal).

Since the number of emplyees is bounded (no negative employees -> "count data"), things like Poisson regression could be worth a try.

Overall your model may be underspecified. If you can, include additional $x$-variables in your model, so to better reflect the data generating process. See page 114 in this book.

$\endgroup$
0
$\begingroup$

Your whole modeling framework is inefficient because a large fraction of observations cluster in a small fraction of the range. You would benefit from switching to log(Profit) and log(Number of Employees). Then the effects you are seeing will be less pronounced. Then the fitted distribution of the small companies will not be as influenced by the long tail of big companies.

Currently you are simply not fitting the small companies well. In formal terms, big companies are currently acting as high-leverage points.

Switching to logarithms is a well-known trick in economics, finance, etc.

$\endgroup$

Your Answer

By clicking “Post Your Answer”, you agree to our terms of service and acknowledge you have read our privacy policy.

Not the answer you're looking for? Browse other questions tagged or ask your own question.