132
$\begingroup$

I am building a regression model and I need to calculate the below to check for correlations

  1. Correlation between 2 Multi level categorical variables
  2. Correlation between a Multi level categorical variable and continuous variable
  3. VIF(variance inflation factor) for a Multi level categorical variables

I believe its wrong to use Pearson correlation coefficient for the above scenarios because Pearson only works for 2 continuous variables.

Please answer the below questions

  1. Which correlation coefficient works best for the above cases ?
  2. VIF calculation only works for continuous data so what is the alternative?
  3. What are the assumptions I need to check before I use the correlation coefficient you suggest?
  4. How to implement them in SAS & R?
$\endgroup$
5
  • 6
    $\begingroup$ I'd say CV.SE is a better place for questions about more theoretical statistics like this. If not, I'd say that the answer to your questions depend on context. Sometimes it makes sense to flatten multiple levels into dummy variables, other times it's worth to model your data according to multinomial distribution, etc. $\endgroup$
    – ffriend
    Commented Aug 3, 2014 at 14:00
  • $\begingroup$ Are your categorical variables ordered ? If yes, this can influence the type of correlation you want to look for. $\endgroup$
    – nassimhddd
    Commented Aug 6, 2014 at 6:58
  • $\begingroup$ i have to face same problem in my research. but i couldn't find the correct method to solve this issue. so if you can please be kind enough to give me the references you have found. $\endgroup$
    – user89797
    Commented Oct 14, 2015 at 8:04
  • $\begingroup$ do you mean p-value is the same as correlation coefficient r? $\endgroup$
    – Ayo Emma
    Commented Mar 31, 2017 at 11:48
  • $\begingroup$ The solution above with ANOVA for categorical vs. continuous is good. Small hiccough. The smaller the p-value, the better the "fit" between the two variables. Not the other way around. $\endgroup$
    – myudelson
    Commented Sep 27, 2017 at 14:52

1 Answer 1

128
$\begingroup$

Two Categorical Variables

Checking if two categorical variables are independent can be done with Chi-Squared test of independence.

This is a typical Chi-Square test: if we assume that two variables are independent, then the values of the contingency table for these variables should be distributed uniformly. And then we check how far away from uniform the actual values are.

There also exists a Crammer's V that is a measure of correlation that follows from this test

Example

Suppose we have two variables

  • gender: male and female
  • city: Blois and Tours

We observed the following data:
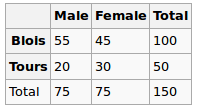
observed values

Are gender and city independent? Let's perform a Chi-Squred test. Null hypothesis: they are independent, Alternative hypothesis is that they are correlated in some way.

Under the Null hypothesis, we assume uniform distribution. So our expected values are the following
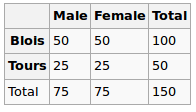
expected value

So we run the chi-squared test and the resulting p-value here can be seen as a measure of correlation between these two variables.

To compute Crammer's V we first find the normalizing factor chi-squared-max which is typically the size of the sample, divide the chi-square by it and take a square root

crammers v

R

tbl = matrix(data=c(55, 45, 20, 30), nrow=2, ncol=2, byrow=T)
dimnames(tbl) = list(City=c('B', 'T'), Gender=c('M', 'F'))

chi2 = chisq.test(tbl, correct=F)
c(chi2$statistic, chi2$p.value)

Here the p value is 0.08 - quite small, but still not enough to reject the hypothesis of independence. So we can say that the "correlation" here is 0.08

We also compute V:

sqrt(chi2$statistic / sum(tbl))

And get 0.14 (the smaller v, the lower the correlation)

Consider another dataset

    Gender
City  M  F
   B 51 49
   T 24 26

For this, it would give the following

tbl = matrix(data=c(51, 49, 24, 26), nrow=2, ncol=2, byrow=T)
dimnames(tbl) = list(City=c('B', 'T'), Gender=c('M', 'F'))

chi2 = chisq.test(tbl, correct=F)
c(chi2$statistic, chi2$p.value)

sqrt(chi2$statistic / sum(tbl))

The p-value is 0.72 which is far closer to 1, and v is 0.03 - very close to 0

Categorical vs Numerical Variables

For this type we typically perform One-way ANOVA test: we calculate in-group variance and intra-group variance and then compare them.

Example

We want to study the relationship between absorbed fat from donuts vs the type of fat used to produce donuts (example is taken from here)
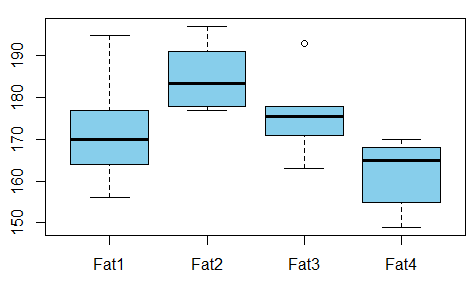
donuts

Is there any dependence between the variables? For that we conduct ANOVA test and see that the p-value is just 0.007 - there's no correlation between these variables.

R

t1 = c(164, 172, 168, 177, 156, 195)
t2 = c(178, 191, 197, 182, 185, 177)
t3 = c(175, 193, 178, 171, 163, 176)
t4 = c(155, 166, 149, 164, 170, 168)

val = c(t1, t2, t3, t4)
fac = gl(n=4, k=6, labels=c('type1', 'type2', 'type3', 'type4'))

aov1 = aov(val ~ fac)
summary(aov1)

Output is

            Df Sum Sq Mean Sq F value  Pr(>F)   
fac          3   1636   545.5   5.406 0.00688 **
Residuals   20   2018   100.9                   
---
Signif. codes:  0 ‘***’ 0.001 ‘**’ 0.01 ‘*’ 0.05 ‘.’ 0.1 ‘ ’ 1

So we can take the p-value as the measure of correlation here as well.

References

$\endgroup$
8
  • 1
    $\begingroup$ Thanks Alexey for the details. Based on more research i found about polyserial and polychloric correlation. How is your approach better than these? Please explain $\endgroup$ Commented Aug 17, 2014 at 9:58
  • 1
    $\begingroup$ I'm not aware of these things, sorry. $\endgroup$ Commented Aug 17, 2014 at 14:04
  • 1
    $\begingroup$ Your first example is NOT about categorical vs categorical, rather it is categorical vs numerical, in fact you are looking at city against number of males (females, respectively) which is numerical. Categorical vs categorical would be, say, city vs colour of the eyes or shapes or anything else, but by no means would it be the number of representative of the gender. $\endgroup$
    – gented
    Commented Mar 13, 2017 at 18:35
  • 2
    $\begingroup$ @AlexeyGrigorev If our data is not normally distributed, should kruskal-wallic be used instead of one-way anova? Thanks in advance. $\endgroup$
    – ebrahimi
    Commented Aug 29, 2018 at 19:28
  • 1
    $\begingroup$ aov(y~x) is analogous to lm(y~x) in interpretation, and the p-value for lm model output is interpreted as whether there is relationship between x and y, i.e. smaller the p-value, stronger the relationship (or higher the correlation). Then I fail to see how p-value here can be taken as the "measure of correlation" as you stated.... $\endgroup$ Commented Jun 30, 2021 at 11:08

Not the answer you're looking for? Browse other questions tagged or ask your own question.