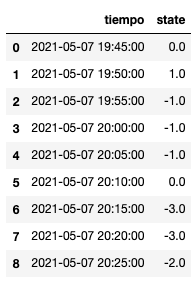
I am working in Python, I have a DataFrame whose index is of type DateTime, the times of the index are not continuous. You can see that the first three data are in sequence and after the third data it goes directly to minute 50. The entire DataFrame has this feature.
datos_frecuencia
<class 'pandas.core.frame.DataFrame'>

                        State
2021-05-07 19:45:00      1.0
2021-05-07 19:46:00     -1.0
2021-05-07 19:47:00      0.0
2021-05-07 19:50:00     -1.0
2021-05-07 19:51:00      1.0
2021-05-07 19:52:00      1.0
2021-05-07 19:55:00      1.0
2021-05-07 19:56:00     -1.0
2021-05-07 19:57:00     -1.0
2021-05-07 20:00:00     -1.0
2021-05-07 20:01:00      1.0
2021-05-07 20:02:00     -1.0
2021-05-07 20:05:00     -1.0
2021-05-07 20:06:00      1.0
2021-05-07 20:07:00     -1.0
2021-05-07 20:10:00      0.0
2021-05-07 20:11:00     -1.0
2021-05-07 20:12:00      1.0
2021-05-07 20:15:00     -1.0
2021-05-07 20:16:00     -1.0
2021-05-07 20:17:00     -1.0
2021-05-07 20:20:00     -1.0
2021-05-07 20:21:00     -1.0
2021-05-07 20:22:00     -1.0
2021-05-07 20:25:00     -1.0
2021-05-07 20:26:00      0.0
2021-05-07 20:27:00     -1.0
I need to group this DataFrame in groups of 3 by 3, to perform the sum of the column "State".
I have tried using resample (), as follows.
datos_frecuencia["State"].resample("3min").sum()

2021-05-07 19:54:00    0
2021-05-07 19:57:00   -1
2021-05-07 20:00:00   -1
2021-05-07 20:03:00   -1
2021-05-07 20:06:00    0
2021-05-07 20:09:00   -1
2021-05-07 20:12:00    1
2021-05-07 20:15:00   -3
2021-05-07 20:18:00   -1
2021-05-07 20:21:00   -2
2021-05-07 20:24:00   -1
2021-05-07 20:27:00   -1
But the result is not what is expected, since in this way, resample () takes times that in the original DataFrame does not exist. For example resample shows: 2021-05-07 20:03:00 -1, when minute 3 of hour 20 is not found in the main DataFrame.
You would need it to be grouped as follows, taking the sum of the "state" column:
                        State
[2021-05-07 19:45:00     1.0
2021-05-07 19:46:00     -1.0
2021-05-07 19:47:00      0.0]

[2021-05-07 19:50:00    -1.0
2021-05-07 19:51:00      1.0
2021-05-07 19:52:00      1.0]

[2021-05-07 19:55:00     1.0
2021-05-07 19:56:00     -1.0
2021-05-07 19:57:00     -1.0]

[2021-05-07 20:00:00    -1.0
2021-05-07 20:01:00      1.0
2021-05-07 20:02:00     -1.0]

[2021-05-07 20:05:00    -1.0
2021-05-07 20:06:00      1.0
2021-05-07 20:07:00     -1.0]

[2021-05-07 20:10:00     0.0
2021-05-07 20:11:00     -1.0
2021-05-07 20:12:00      1.0]

[2021-05-07 20:15:00    -1.0
2021-05-07 20:16:00     -1.0
2021-05-07 20:17:00     -1.0]

[2021-05-07 20:20:00    -1.0
2021-05-07 20:21:00     -1.0
2021-05-07 20:22:00     -1.0]

[2021-05-07 20:25:00    -1.0
2021-05-07 20:26:00      0.0
2021-05-07 20:27:00     -1.0]
The end result should be a dataFrame with the following data:
                        State
2021-05-07 19:45:00     0.0
2021-05-07 19:50:00     1.0
2021-05-07 19:55:00    -1.0
2021-05-07 20:00:00    -1.0
2021-05-07 20:05:00    -1.0
2021-05-07 20:10:00     0.0
2021-05-07 20:15:00    -3.0
2021-05-07 20:20:00    -3.0
2021-05-07 20:25:00    -2.0
You know some function in Pandas, with which you can obtain this result.

