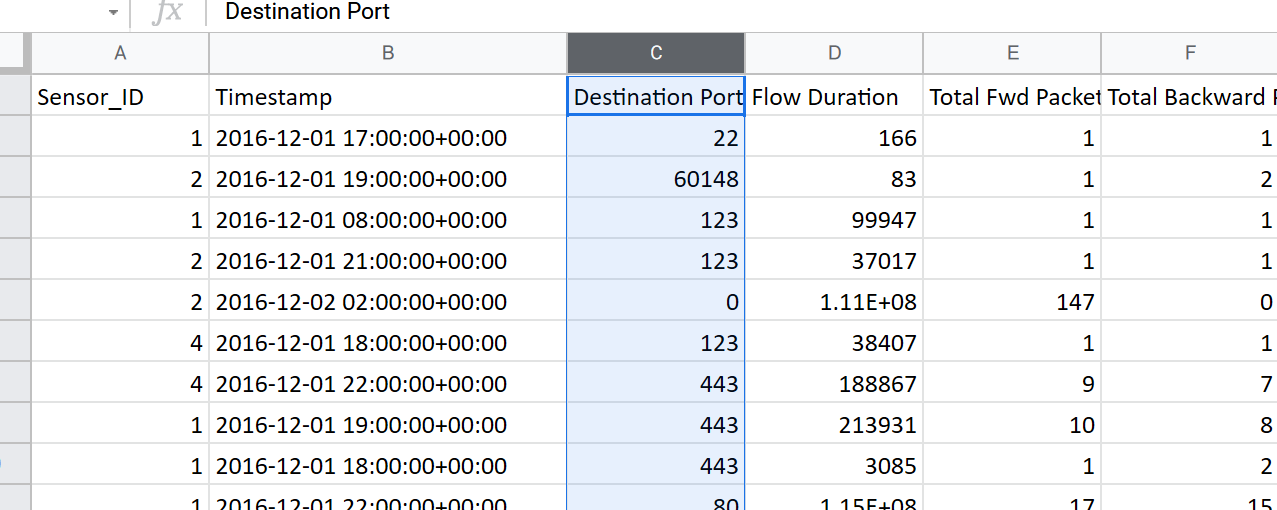
I have unsupervised sensor data and i want to lable each row of data as anomaly or normal. Here K-mean clustering will work?
3 Answers
In the case you don't have a good accuracy with K-Means, here is an interesting option with code that uses the Mahalanobis Distance:
https://towardsdatascience.com/unsupervised-learning-for-anomaly-detection-44c55a96b8c1
-
$\begingroup$ what about isolation forest ? it will also work ? $\endgroup$– user12Commented Jun 26, 2021 at 2:57
-
$\begingroup$ Isolation forest is a linear algorithm but efficient: It will work, but maybe with a worse result than the Mahalanobis Distance using normal distribution. The best solution would be to compare several anomaly algorithm between each other, using code like this one: scikit-learn.org/stable/auto_examples/miscellaneous/… $\endgroup$ Commented Jun 28, 2021 at 7:28
-
$\begingroup$ I recommend to use dimensional reduction algorithms (tSNE, UMAP, PCA or LDA) to visualize your data clearly and detect outliers: youtube.com/watch?v=wvsE8jm1GzE&t=104s scikit-learn.org/stable/modules/generated/… $\endgroup$ Commented Jun 28, 2021 at 7:30
-
$\begingroup$ Note: If your anomaly detection doesn't depend on time, you shouldn't take the timestamp into account. $\endgroup$ Commented Jun 28, 2021 at 8:05
Here K-mean clustering will work?
Theoretically, yes! the algorithm can be applied to your problem. You can scale K-Means to any number of dimensions and not just 2 or 3. Maths remains the same no matter how many dimensions of data you have.
Practically, you will need to actually train the algorithm and perform the evaluation on the unseen data to check you are getting a good accuracy (or any other metric).
Some references you can use for implementation - https://jakevdp.github.io/PythonDataScienceHandbook/05.11-k-means.html
Some suggestions (but I have not seen the data, this is on the basis of raw assumptions) -
- I don't think the time column will be of any use directly. Rather, you will need to extract features out of it. Like some anomalies might be occurring in the night, on Monday, or between 10:00 AM to 11:00 AM. Create more columns on the basis of these criteria if needed.
- No need to use silhouette or elbow methods as you already know the number of clusters. But, you can use these methods if you want to categorize the anomalies into further classes.
K-means is mainly used to detect clusters using 2D or 3D plots. Here you have more than 4 dimensions. You will want to use an anomaly detection algorithm. Random Forest could be interesting in your case.
https://scikit-learn.org/stable/modules/generated/sklearn.ensemble.RandomForestClassifier.html
-
1$\begingroup$ That is not at all true. You can use K-Means for any number of dimensions. Also, OP mentioned the data is unsupervised and random forest is a supervised algorithm. $\endgroup$ Commented Jun 24, 2021 at 15:08
-
$\begingroup$ OK, I didn't know that about K-means, thanks for the information. $\endgroup$ Commented Jun 24, 2021 at 16:12

