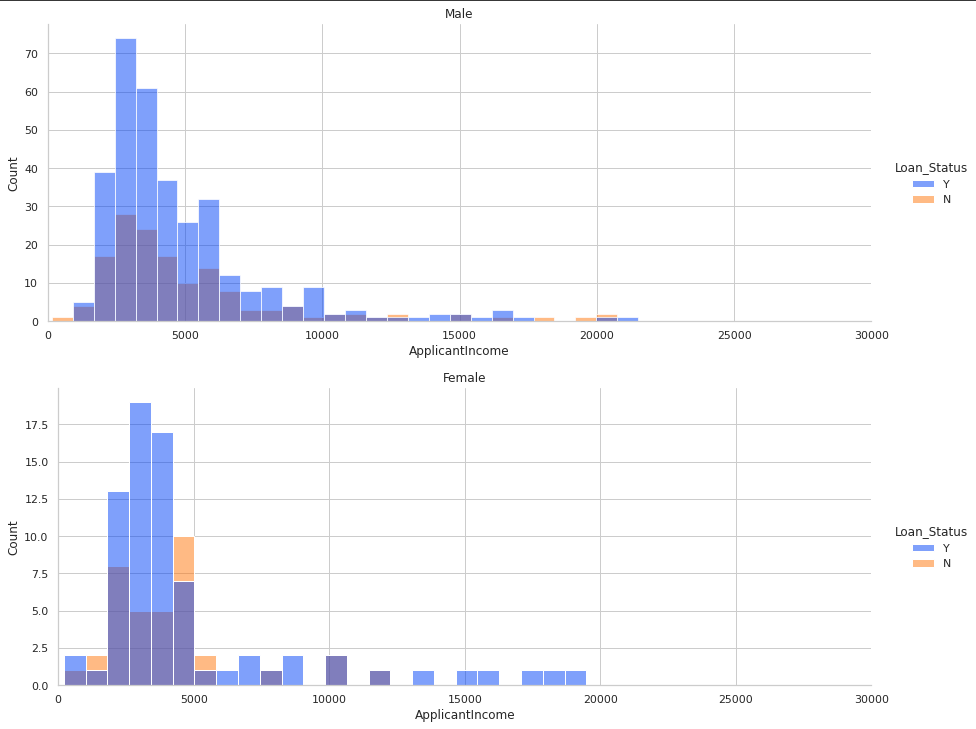
I am working with a dataset that contains data of applicant income, gender, and loan status (whether or not the person was approved for a loan). I've created the following plots from the data. The histogram plot is:
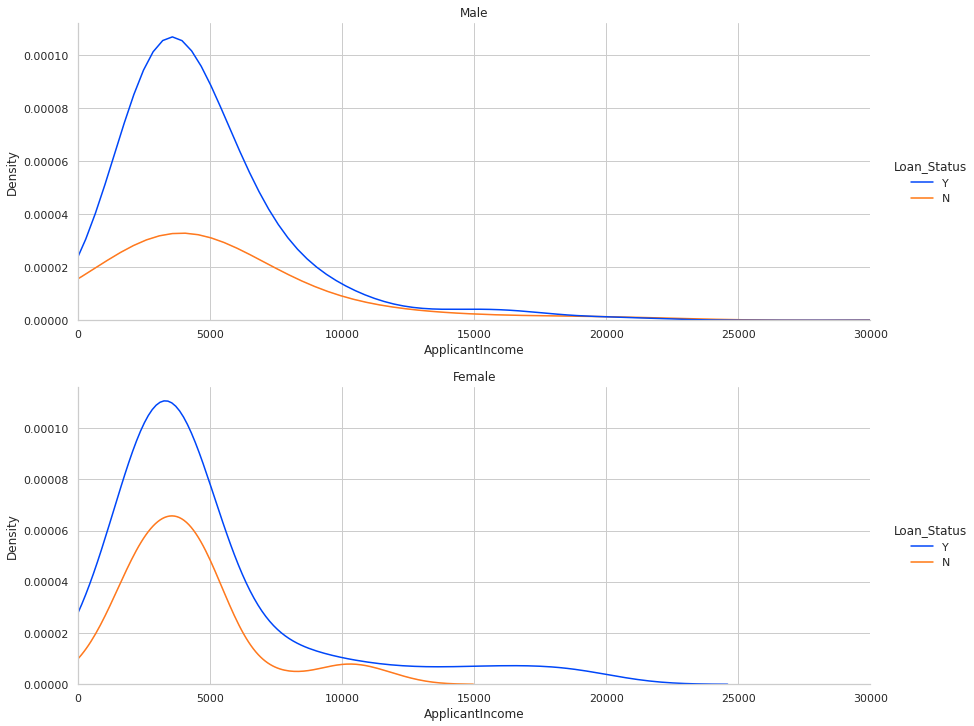
The kernel density estimate (KDE) plot is:
The KDE plots seem to indicate that the accepted to rejected ratio among men is higher for a given income than compared to women. I want to investigate this further. Note (!) there are more men in the dataset than women, so any conclusions will need to take the variance into account.
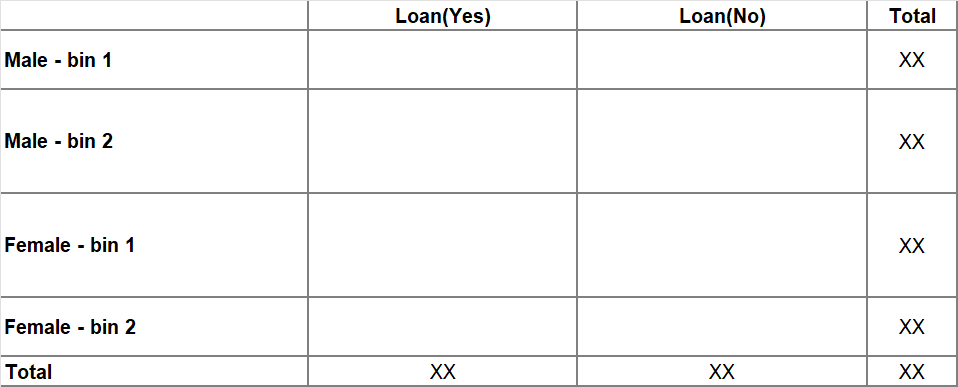
An idea: My initial idea was to bin the incomes and compute the ratio of accepted/rejected in each bin for each gender. We can then plot the ratio and the variance (using the counts of men/women in each bin) to see if there is a statistical significance in the dependence of accepted/rejected on gender.
Question: Is the above idea sound? Should I formulate this a hypothesis testing problem? If so, how would I go about doing this?


