I assume this is more reasonable to talk about error vectors not matrices in most cases. You have a vector is errors, only one column.
The parameters "m" and "c" in iyour example depends on the errors. Eventually they'll be picked in a way minimizing your cost function. They'll be different for MSE and MAE. The first one will try to make a mistake on outliers better.
Here I'm talking mostly about cost function but expect something similar for them in role of metrics as well.
Example:

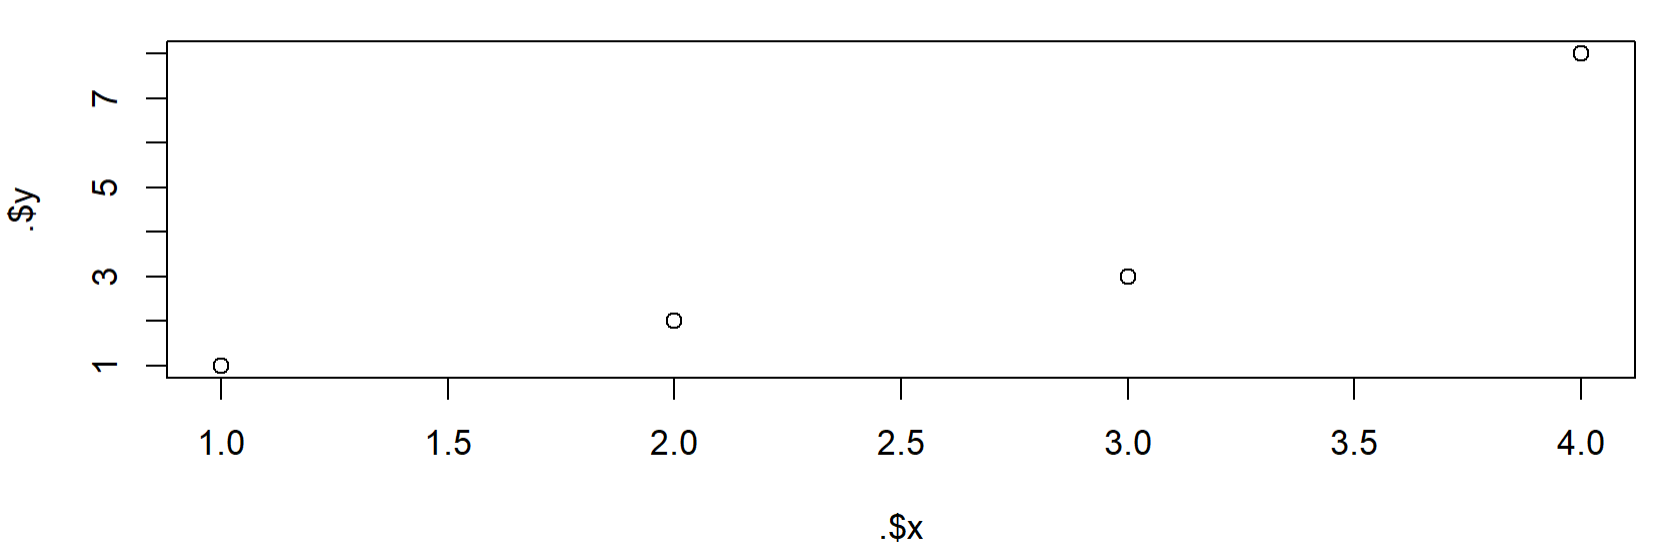
Here I create a 4 observations example. I use RMSE for comparision because MSE gives squared residuals, we want to get them back to the original non-squared scale at first.
The first 3 observations imply a very plain model y = 1 * x + 0. Then I compare it with the model y = 2*x using residuals
> tibble(x=1:4, y=c(1,2,3,8)) %>%
+     {plot(.$x, .$y); .} %>%
+     mutate(base_pred=x * 1) %>%
+     mutate(outl_pred=x * 2) %>%
+     mutate(across(ends_with('pred'), ~abs(. - y),
        .names='{str_remove(col, "_pred")}_resi')) %>%
+     print() %>%
+     rename_with(~str_remove(., '_resi')) %>%
+     summarise(across(c(base, outl), list(
+         mae=~mean(.),
+         rmse=~sqrt(mean(. ^ 2))))) %>%
+     select(ends_with('mae'), everything())

      x     y base_pred outl_pred base_resi outl_resi
  <int> <dbl>     <dbl>     <dbl>     <dbl>     <dbl>
1     1     1         1         2         0         1
2     2     2         2         4         0         2
3     3     3         3         6         0         3
4     4     8         4         8         4         0

  base_mae outl_mae base_rmse outl_rmse
     <dbl>    <dbl>     <dbl>     <dbl>
1        1      1.5         2      1.87
You may see that base_model is better if you use MAE. Otherwise y=x*2 gives you better metric with RMSE because it suffers more and is more focused on outliers.

