0
$\begingroup$

I have chosen the topic of "Predicting future airfare using past data" for my project and would love to get inputs on the best models to use.

Data Set

The data set consists of 6 months of time series data for every onward and return journey dates spaced by 8 days for a particular route. So, for the trip of 1 Oct-9 Oct, 2017, I have the flight price checked every day from 1 Apr to 30 Sep. I have this data for every trip date from 1 July, 2017 to 15 Oct, 2017.

Data Format

(Fake Data)

+--------------------+-----------+--------------------+--------------------------+---------------+
| requestDate        | price     | tripStartDeparture | tripDestinationDeparture | flightCarrier |
+--------------------+-----------+--------------------+--------------------------+---------------+
| 14APR2017:00:00:00 | 725.32    | 16SEP2017:10:50:02 | 23SEP2017:21:55:04       | XA            |
+--------------------+-----------+--------------------+--------------------------+---------------+
| 15APR2017:00:00:00 | 966.32    | 16SEP2017:13:20:02 | 23SEP2017:19:00:04       | XA            |
+--------------------+-----------+--------------------+--------------------------+---------------+
| 16APR2017:00:00:00 | 915.32    | 16SEP2017:13:20:02 | 23SEP2017:21:55:04       | XA            |
+--------------------+-----------+--------------------+--------------------------+---------------+
+--------------------+-----------+--------------------+--------------------------+---------------+
| 16APR2017:00:00:00 | 825.32    | 16SEP2017:10:50:02 | 23SEP2017:21:55:04       | XA            |
+--------------------+-----------+--------------------+--------------------------+---------------+
| 16APR2017:00:00:00 | 969.32    | 11SEP2017:13:20:02 | 18SEP2017:19:00:04       | XA            |
+--------------------+-----------+--------------------+--------------------------+---------------+
| 16APR2017:00:00:00 | 918.32    | 06SEP2017:13:20:02 | 13SEP2017:21:55:04       | XA            |
+--------------------+-----------+--------------------+--------------------------+---------------+

Data Exploration

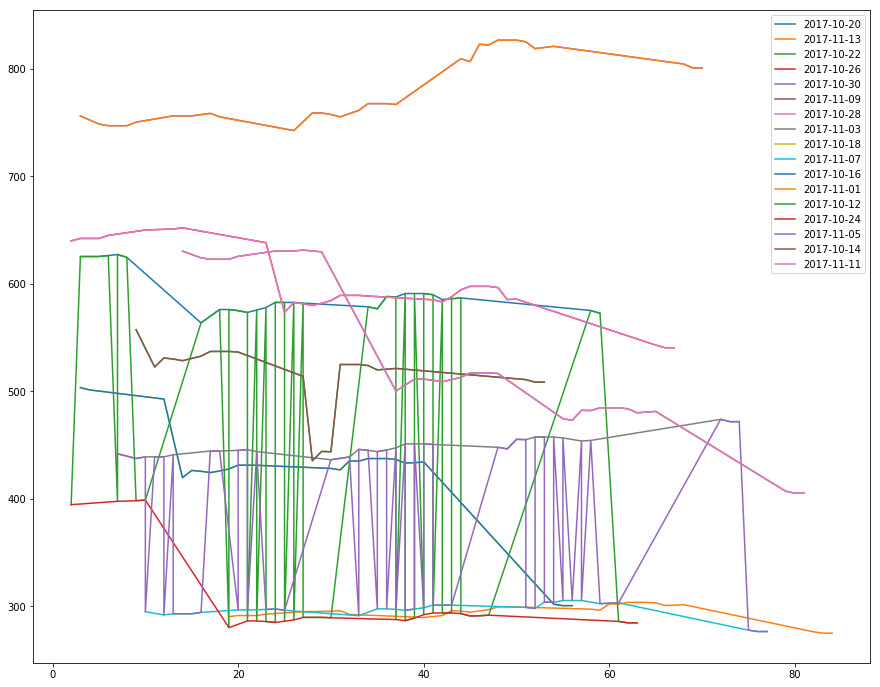
Variation in price for different start dates. X-axis: (Observation date - start date).days, Y-axis: Price in USD

Variation in price for different start dates. X-axis: (Observation date - start date).days, Y-axis: Price in USD

Goal

For a given trip dates, the goal is to predict the price in the future, given the price today.

Approach

Despite the data being for 6 months for each trip date, airfares are mostly constant in until about 120 days before departure. It becomes quite noisy in those 120 days. Most probably, because 120 data points are little for time series forecasting, ARIMA did not perform very well. However, I think it is possible to create a way better model utilizing the data for all the data for all trips from 1 July, 2017 to 15 Oct, 2017.

I would love to hear about possible approaches. Thank you for reading this wall of text.

$\endgroup$
7
  • $\begingroup$ how come you chose only those dates?, is that because the data shows only on those date people travel in that route? or only on those dates the flights run? $\endgroup$
    – Toros91
    Commented Nov 18, 2017 at 18:06
  • $\begingroup$ This was a sample data for the route that I am considering. The data shows the price of any given trip (with the star date mentioned) X days before the journey started. The fluctuations don't seem to have a pattern. I have this data for 105 different trip start dates $\endgroup$
    – sera
    Commented Nov 21, 2017 at 2:30
  • $\begingroup$ do you think using time series is a wise decision here? $\endgroup$
    – Toros91
    Commented Nov 21, 2017 at 2:36
  • $\begingroup$ Given the lack of correlation and scarcity of data points, I don't think so. Exploring what other methods I can use. $\endgroup$
    – sera
    Commented Nov 21, 2017 at 4:16
  • $\begingroup$ hmm good that would be better! as you can see that the frequency at which the data is collected is not in a symmetric fashion. $\endgroup$
    – Toros91
    Commented Nov 21, 2017 at 4:38

2 Answers 2

1
$\begingroup$

I liked the way you put across your question!

I think we cannot cannot say in specific will work well with data, it is most likely trial & error method, If ARIMA is not performing well and assuming that there is no trend in data then you can use AR, Exponential Smoothening. These are basic techniques but as you know in many scenarios basic models can explain better than complex models.

These both works well in such scenarios. Give a try.

It would be nice if you can share some graphs which can explain us a bit more about the how the data is, noise etc. I mean if you have anything from your exploratory analysis.

Hope my answer is helpful!

$\endgroup$
5
  • $\begingroup$ Thank you. Will update the question with my exploratory analysis. The basic problem with ARIMA etc is that I am just using the time series for a particular trip date for the forecasting. I am trying to brainstorm how I can 'learn' from the 105 different time series for the same route; but for different trip dates. $\endgroup$
    – sera
    Commented Nov 12, 2017 at 7:02
  • $\begingroup$ Added a graph to show the data for different start dates. I have a time series for every start date. The number of data points in every series is ~100. I have 105 different time series corresponding to the different start dates. The part I am struggling with is: how do I combine the learning from all these time series. $\endgroup$
    – sera
    Commented Nov 18, 2017 at 18:07
  • $\begingroup$ The data does different start dates do not seem to be correlated. $\endgroup$
    – sera
    Commented Nov 21, 2017 at 2:33
  • $\begingroup$ No, at moment, I am only considering the data for one particular carrier on one route for different trip start dates $\endgroup$
    – sera
    Commented Nov 21, 2017 at 4:15
  • $\begingroup$ Thanks a lot for the resource. I agree with you in general. However the route that I am considering has a monopoly on non-stops. So, my intuition was that there should be lower dependence on other routes. $\endgroup$
    – sera
    Commented Nov 23, 2017 at 8:50
0
$\begingroup$

Maybe you could try to turn this seemingly time series problem into a classification.

I would then create a set of features, e.g: number of days between requestDate and tripStartDeparture

  • binned departure and arrival times, e.g. 0-2, 3-5, .. 23

  • travel time (tripDestinationDeparture - tripStartDeparture)

  • day of the week, categorical features for both departure and arrival

  • categorical feature for month

  • flight carrier: maybe you can categorize them from low-cost to high-end airline

  • etc..

Actually, a bunch of new features can be created from your initial dataset if you are a little creative.

Then try out a series of classifiers independently then stack them to see model acccuracy you can get.

$\endgroup$
2
  • $\begingroup$ Interesting. You are you saying, I should classify which time series in the training data is the closest match to the the data for the day I am trying to predict? $\endgroup$
    – sera
    Commented Nov 21, 2017 at 2:39
  • $\begingroup$ (I am not sure I understand your comment) I mean create features for the whole dataset. Then , you will split it into training, validation and test as machine learning.people usually do. $\endgroup$
    – tagoma
    Commented Nov 21, 2017 at 22:05

Your Answer

By clicking “Post Your Answer”, you agree to our terms of service and acknowledge you have read our privacy policy.

Not the answer you're looking for? Browse other questions tagged or ask your own question.