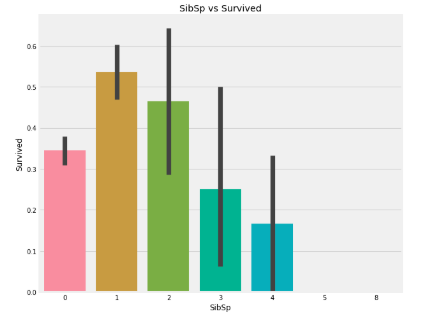
I am using seaborn library to perform EDA on a dataset having categorical variables. I am using barplot function and in that there are some black bars which I guess are error bars as I read in documentation. What do these error bars represent and how are they calculated ?
1 Answer
$\begingroup$
$\endgroup$
It appears that even if you don't enter ci argument, it's set to 95 by default in barplot method, which gives you those error bars. If you don't want them, set ci = None while plotting. The bar is the confidence interval for the variable as the library describes, i.e. it's interval where the 95 % of your variable lies in, which is estimated by bootstrapping.

