Question
Why lmplot show the line but regplot does not?
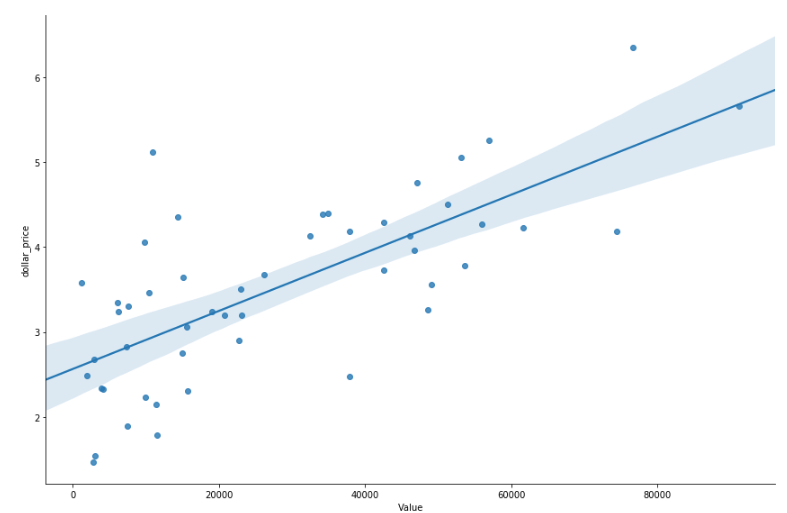
lmplot
import seaborn as sns
import matplotlib.pyplot as plt

sns.lmplot(x="Value", y="dollar_price", data=merged_df, height=8, aspect=1.5)
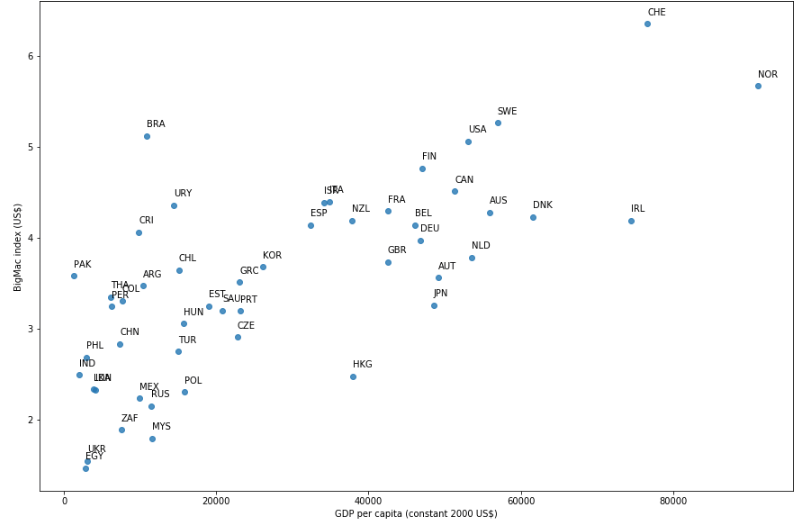
regplot
# seaborn.regplot() returns matplotlib.Axes object
plt.rcParams['figure.figsize'] = (15,10)
ax = sns.regplot(x="Value", y="dollar_price", data=merged_df, fit_reg=False)
ax.set_xlabel("GDP per capita (constant 2000 US$) 2017")
ax.set_ylabel("BigMac index (US$)")

# Label the country code for those who demonstrate extreme BigMac index
for row in merged_df.itertuples():
    ax.text(row.Value,row.dollar_price+0.1,row.country)
Documentation
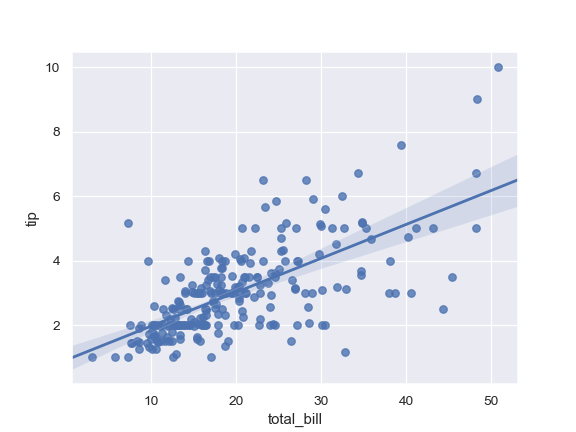
seaborn.regplot documentation page shows the line. So I suppose there is something missing?
>>> import seaborn as sns; sns.set(color_codes=True)
>>> tips = sns.load_dataset("tips")
>>> ax = sns.regplot(x="total_bill", y="tip", data=tips)


