1
$\begingroup$

enter image description here

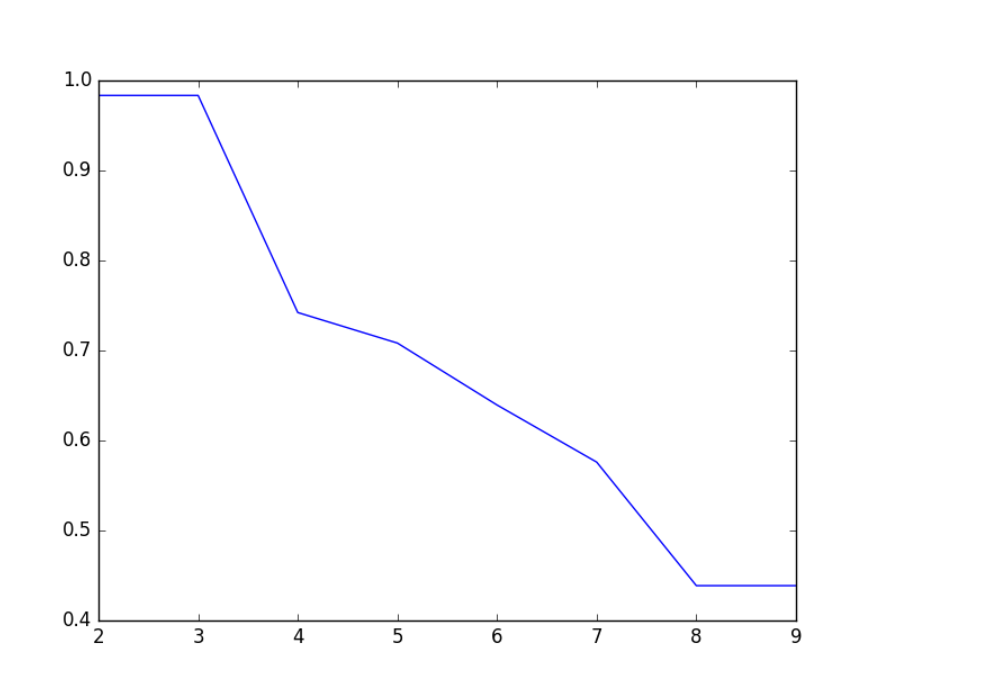
This is from running kmeans clustering with k on the x-axis (ranging from 2 to 10) and the silhouette distance on the y-axis.

Clearly there's peaks at k=3, k=4 and it seems to decline from there. It doesn't resemble an elbow and thought it should rise as k gets larger (due to over fitting on he training set). Do I just lack data?

I'm computing the silhouette distance using a 80-20 train test split.

$\endgroup$
2
  • $\begingroup$ So, what’s the size of your data? $\endgroup$
    – pythinker
    Commented Apr 8, 2019 at 20:46
  • $\begingroup$ few thousand rows , TFIDF based clustering ~ 50 000 features $\endgroup$
    – MrL
    Commented Apr 8, 2019 at 21:59

1 Answer 1

1
$\begingroup$

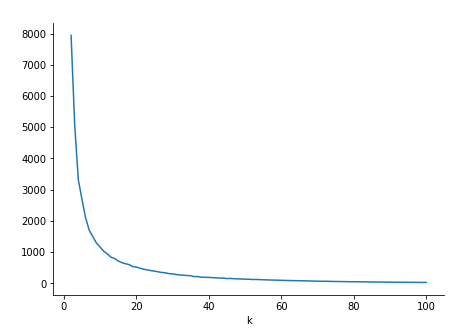
First of all, you do have two elbows: one at $k=4$ and a large one at $k=8$. The second isn't very apparent because you haven't drawn out the plot for larger values of $k$. If you do you might get a figure like this:

Secondly, you aren't meant to look for an elbow when computing the silhouette score! The silhouette score accounts for both inter- and intra-cluster distance, as such it can be used for selecting $k$ on its own (i.e. select the $k$ that produces the best silhouette score).

Note: I'm not familiar with the "silhouette distance", I assume it is somewhat related to the silhouette score (maybe its inverse).

The "elbow" criterion should be used when dealing with metrics that tend to improve as $k$ increases (e.g. inertia).

$\endgroup$

Your Answer

By clicking “Post Your Answer”, you agree to our terms of service and acknowledge you have read our privacy policy.

Not the answer you're looking for? Browse other questions tagged or ask your own question.