10
$\begingroup$

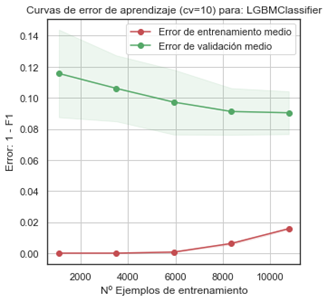
I read about the validation_curve and how interpret it to know if there are over-fitting or underfitting, but how can interpret the plot when the data is the error like this:

enter image description here

  • The X-axis is "Nº of examples of training"
  • Redline is train error
  • Green line is validation error

Thanks

$\endgroup$
1
  • $\begingroup$ To make this findable by others who have the same question, to help others better understand your question to potentially answer it, and to make the question more accessible to others, can you describe what you're seeing in the plot and what you'd like explained? Do you understand these sorts of "learning plots" in general and you're having trouble understanding this specific one? Have you seen different types of "learning plots" (e.g. with different X- and Y-axes), but not ones that are represented in this way? $\endgroup$
    – NotThatGuy
    Commented Jun 27, 2020 at 19:18

2 Answers 2

11
$\begingroup$
  • The X axis is the number of instances in the training set, so this plot is a data ablation study: it shows what happens for different amount of training data.
  • The Y axis is an error score, so lower value means better performance.
  • In the leftmost part of the graph, the fact that the error is zero on the training set until around 6000 instances points to overfitting, and the very large difference of the error between the training and validation confirms this.
  • In the right half of the graph the difference in performance starts to decrease and the performance on the validation set seems to be come stable. The fact that the training error becomes higher than zero is good: it means that the model starts generalizing instead of just recording every detail of the data. Yet the difference is still important, so there is still a high amount of overfitting.
$\endgroup$
2
  • $\begingroup$ Thanks for the answer in relation to "Yet the difference is still important" when is too close to can say there are not difference, or in other words, If the two lines will be parralels, with only 0.01 point of difference, the meaning is the same? $\endgroup$
    – Tlaloc-ES
    Commented Jun 27, 2020 at 13:30
  • 1
    $\begingroup$ @Tlaloc-ES the concept of overfitting is not very precise, there are cases where it's clear but very often one can't say for sure. in fact a perfectly good model often has at least a bit of overfiting. so no I wouldn't say there's overfitting if the two curves were close, but here there is a 0.1 F-score point difference (quite large) on a large dataset so I'd expect the two curves to be closer with a "good" model. Also it looks like the training error could keep increasing if there were more instances, whereas the curve would become constant with a stable model. $\endgroup$
    – Erwan
    Commented Jun 27, 2020 at 14:24
4
$\begingroup$

It is pretty clear that your model is overfitting as your validation error is way higher than your training error.

This also means that more data allows your model to overfit less. If you are to have 20k examples I'm betting that your validation error will be slightly lower and your training error will be slightly higher.

However, I also see a plateau in your validation error, meaning that it is not likely to decrease a lot. If you want to decrease your validation error significantly, consider:

  • Using a model that overfits less - either a different algorithm or set your parameters to a lower bias configuration.
  • Using new features/information.
  • Get more data, but again this is unlikely to diminish the validation error significanlty.
$\endgroup$
4
  • $\begingroup$ Overfitting is not when the validation error is higher than the training error, is it? Validation error being higher than training error is rather the norm, especially if you don't use regularization. $\endgroup$
    – noe
    Commented Jun 27, 2020 at 11:46
  • $\begingroup$ you're right, I forgot to say "way higher", I am still not sure that is is the case, as in Wikipedia overfitting is "the production of an analysis that corresponds too closely or exactly to a particular set of data, and may therefore fail to fit additional data or predict future observations reliably". To me, if the validation error is way higher than the training error there is some overfitting. Do you agree? $\endgroup$ Commented Jun 27, 2020 at 11:49
  • $\begingroup$ To some degree. I see overfitting if, at the beginning of the training, both training and validation errors go down and, at some point, the training error continues going down and the validation error goes up. This means that the system started memorizing the training data and therefore overfitting. If both curves keep going down until each one stabilizes at certain point, then I would not say that the system is overfitting unless their difference is very large. $\endgroup$
    – noe
    Commented Jun 27, 2020 at 17:21
  • $\begingroup$ The way I understand it: overfitting happens when the model is learning noise, in addition to general features. Often learning noise makes the model predict worse, and therefore, validation error goes up, but it is not always the case. I would say that even if learning noise is harmless, the model is still overfitting. Also, zero percent error on the training set and higher error rate on validation set is a strong indicator of overfitting, but again, but is not necessarily true, for example training set could be much easier to predict than validation set. $\endgroup$
    – Akavall
    Commented Jun 28, 2020 at 0:43

Your Answer

By clicking “Post Your Answer”, you agree to our terms of service and acknowledge you have read our privacy policy.

Not the answer you're looking for? Browse other questions tagged or ask your own question.