2
$\begingroup$

Background
I don't know much about (or to say anything) about data science or machine learning. But I'm interested in learning and thought this problem can be solved with machine learning. That's why I'm posting this here, don't even know if this is appropriate or not.

Problem I have some 2D data in pairs of (x,y). I only have the data and don't know anything about what kind of functional feature the data have. Now this data randomly have some wrong values or (should I say) outliers. And I have to fix them before working with that data. Lets show an example: enter image description here
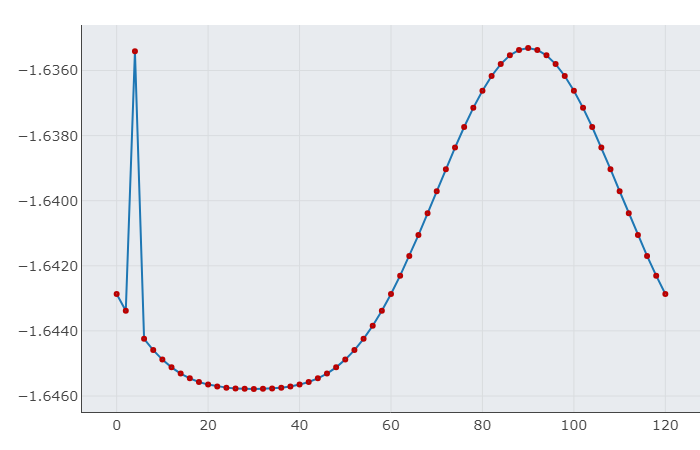
As you can see the data have a nice uniform feature except for the 3rd point, and obviously that's a wrong point. I have fix this kind of points. You can see If I can just detect that point then I can just delete and fit it with surrounding (e.g with a spline). Now I have lots of data just like this, and plotting every time to check and then manually detect and smooth those points is really tiresome.

Now I don't have any idea about how to proceed with this problem. I tried to search but was lost in the huge world of machine learning. So, what kind of methods and technique do I have to learn, so that I can aromatically detect those points. You can show me a sample code (in python preferably) to do this kind of jobs. Thanks.

$\endgroup$
2
  • $\begingroup$ Maybe this might be relevant: towardsdatascience.com/… $\endgroup$
    – Peter
    Commented Jun 6, 2019 at 19:06
  • $\begingroup$ I would say that if all you are after is two dimension outlier detection this can be done without any data science or ML. Assuming that you have the y values in an array called a you can do: b = np.min(np.vstack([np.abs(a[1:] - a[:-1])[1:], np.abs(a[1:] - a[:-1])[:-1]]), axis=0); a[np.hstack([[True], b < b.mean(), [True]])]. This does only work for isolated outliers and will not work on the first and last values in the list but it should be a simple algorithm: compare the differences between points in forward and backward order. $\endgroup$
    – grochmal
    Commented Jun 13, 2019 at 22:29

5 Answers 5

4
$\begingroup$

I recently had a similar problem (removing abnormal peaks from a time series). That's what I suggest you:

  1. Get the smoothed trend. There are several techniques you can employ, such as various forms of exponential smoothing.

  2. Find the difference between actual trend observations and smoothed ones.

  3. Normalize this distribution of distances (using Z-score, i.e. sklearn's StandardScaler)

  4. Substitute the observations that lie k standard deviations away from the mean (that is 0). The choice of x can be arbitrary or data-driven; in my case I chose k = 3 (i.e. a very conservative anomaly removal). You can use the smoothed values as a substitute. In your case, the interpolation could be perhaps a good choice (that's up to your preference).

This will automatically remove abnormal peaks like the one you displayed.

$\endgroup$
3
+25
$\begingroup$

Following is simple example to exclude outliers:

import numpy as np
import pandas as pd
import matplotlib.pyplot as plt
df = pd.DataFrame(np.random.randn(100, 1))
#print(df)

from scipy import stats
df1=df[(np.abs(stats.zscore(df)) < 2).all(axis=1)]
#print(df1)
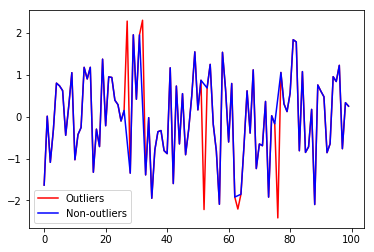
plt.plot(df,'r', label='Outliers')
plt.plot(df1, 'b' ,label='Non-outliers')
plt.legend()

output:

img

description:

  • For each column, first, it calculates the z-score() of each value in the column, relative to the column mean and standard deviation.
  • np.abs(stats.zscore(df)) takes the absolute of Z-score because the direction does not matter, only if it is below the threshold=2.
  • all(axis=1) ensures that for each row, all column satisfy the constraint.
  • Finally, df[] result of this condition is used to index the dataframe.

Approach 2: You can use quantile() and between()

x = pd.Series(np.random.normal(size=20)) # with outliers
#print(x)
o = x[x.between(x.quantile(.25), x.quantile(.75))] # without outliers
#print(x)
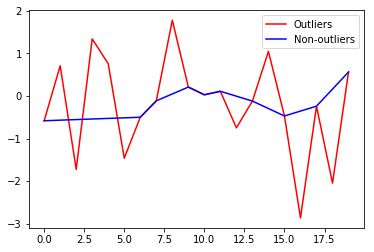
plt.plot(x,'r', label='Outliers')
plt.plot(o, 'b' ,label='Non-outliers')
plt.legend()

img

I also recommend you to check it out these answers: answer1 and answer2

$\endgroup$
2
$\begingroup$

The kind of outliers you are describing are referred to as "point" outliers in literature, as they are abnormal w.r.t their individual value, unlike "context" and "collective" outliers, who are abnormal only when considering their neighbors (context).

For point outliers detection, there are several methods one can use, depending on whether you are interested in an offline or streaming detection, for example.

This repository includes many available ready-to-use algorithms to detect such outliers, for both scenarios.

If you are interested in reading more details about how these techniques work, some relevant papers are:

https://ieeexplore.ieee.org/abstract/document/7954844

https://ieeexplore.ieee.org/abstract/document/7424283/

$\endgroup$
1
$\begingroup$

For each data point calculate the distance to it's left + right neighbour using euclidean distance, by comparing those distances you should see such kind of outliers.

$\endgroup$
0
$\begingroup$

You can also go for Boxplot graph. Refer BoxPlot graph for more Explanation

This will help you out in segregating different values and in case some of the samples have outliers, it will get plotted bit far than the other samples.

So steps could be:

  1. Draw boxplot of your 2D data. How to create BoxPlot?
  2. Intuitively select the acceptable range i.e. samples outside-dimensions(range) consider as an outliers.
  3. Drop samples exist outside such range.

JFI:

  1. Generally we consider outliers are those values, which doesnt fall with in Variance range of the data. Though I'm not the specialist, but boxplot consider the same thing while deciding the Outliers.
  2. "Intuitively select the acceptable range", we can also say Z-score() in statistical term.
$\endgroup$

Your Answer

By clicking “Post Your Answer”, you agree to our terms of service and acknowledge you have read our privacy policy.

Not the answer you're looking for? Browse other questions tagged or ask your own question.