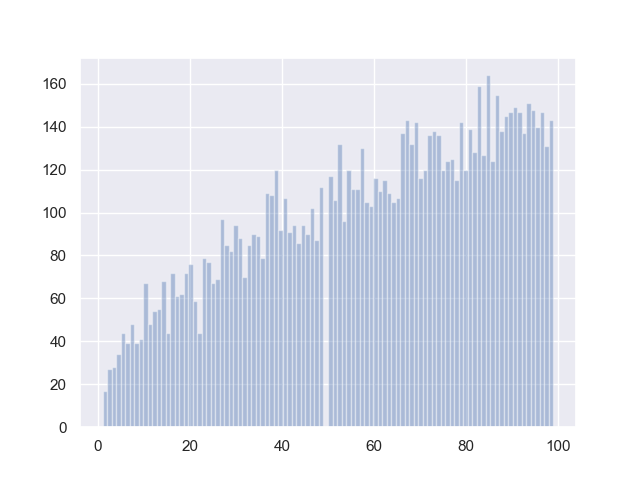
I'm going through this YouTube series on simulation by The Coding Train. I'm trying to graph some filtered random numbers, but seaborn is leaving an odd gap in the very middle of the histogram.

My data is filtered by collecting random numbers bigger than the output of some function, like $y = x^2$. I also tested graphing the output from random integers from 0 to 100 and did not get the same gap in the histogram, so I thought the issue might be my data. However, I also made a graph using pygame and there is no gap, I also inspected my data; numbers from 1 to 100 are all represented.
Code:
# Choose a function.
# Make randints a, b.
# If b > function(a), return b.
# Repeat and collect b.
# Graph b as histogram.

import collections
import matplotlib.pyplot as plt
import numpy as np
import seaborn as sns

sample_size = 10**4
dice_max = 100
def function(x): return (x)**2

def main():
    # Debug: Make random data.
    # values = np.random.randint(0, dice_max, sample_size) # Test different data. Problem goes away.

    # Debug: Inspect values then press enter.
    # for i,(k,v) in enumerate(sorted(collections.Counter(values).most_common())): print(i,k,v); input()

    values = [montecarlo(function) for _ in range(sample_size)]
    pg_histograph(collections.Counter(values))
    sns.set()
    plt.show(sns.distplot(values, bins=dice_max, kde=False, norm_hist=False))

def montecarlo(function):
    """Make randints a, b. If b > function(a), return b."""
    y, b = 1, 0
    while not b > y:
        a, b = (np.random.randint(dice_max) for _ in range(2))
        y = function(a)
    return b

def pg_histograph(bins):
    """Make histograph using pygame."""
    import pygame as pg
    window_width = 800
    window_height = 800
    bar_color = pg.Color('black')
    bg_color = pg.Color('white')
    pg.init()
    window = pg.display.set_mode((window_width, window_height))
    window.fill(bg_color)

    bar_width = int(window_width / len(bins))
    max_count = bins.most_common(1)[0][1]
    for bin_, count in bins.items():
        bar_height = round(count / max_count * window_height) # Fit y values to window.
        x = bin_ * bar_width # Fit x values to bar size.
        y = window_height - bar_height # Bars extend downward from x,y, so they need to be shifted up by bar_height.
        pg.draw.rect(window, bar_color, (x, y, bar_width, bar_height))
    pg.display.update()

main()
