1
$\begingroup$

I am working with single time-series measurements that I want to plot for the time window of about 1 week.

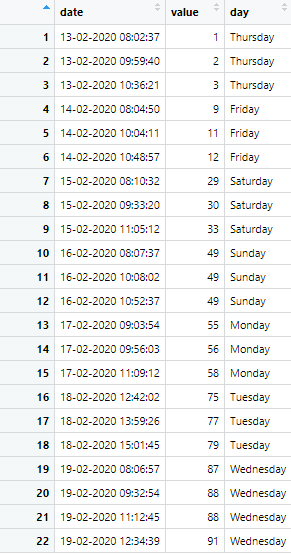
This is the data I am working with.

This is my R script:

library(tidyverse)
library(ggplot2)

filesource <- "C:/ ... /testData.csv"
df <-read.csv(filesource, header = TRUE)

ggplot() +
  geom_line(data = df, aes(x = date, y = value, group = 1), color = "red") +
  ggtitle("Some Measure over Time") +
  xlab("Time") +
  ylab("Some Measure in %")

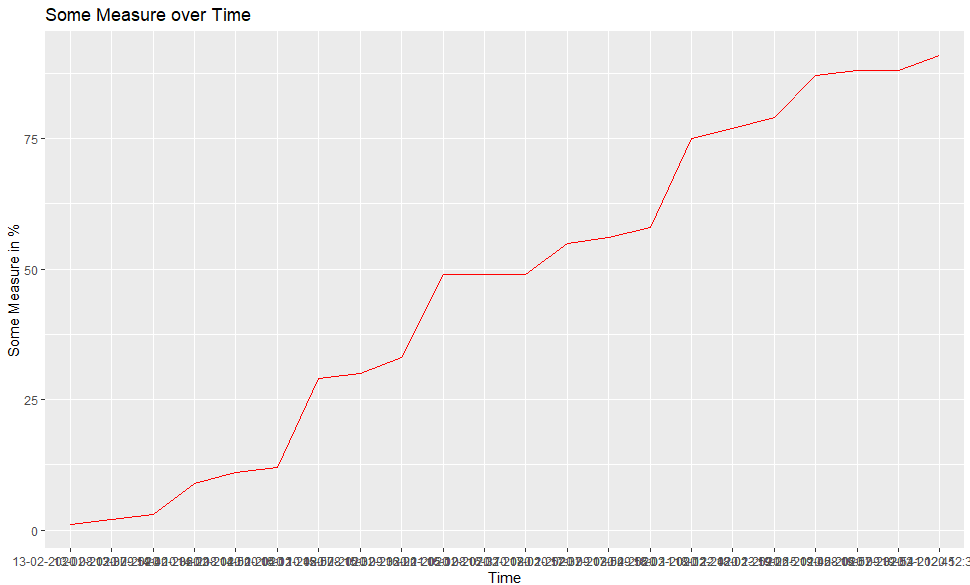
This produces this plot.

time series data with date time on x-axis

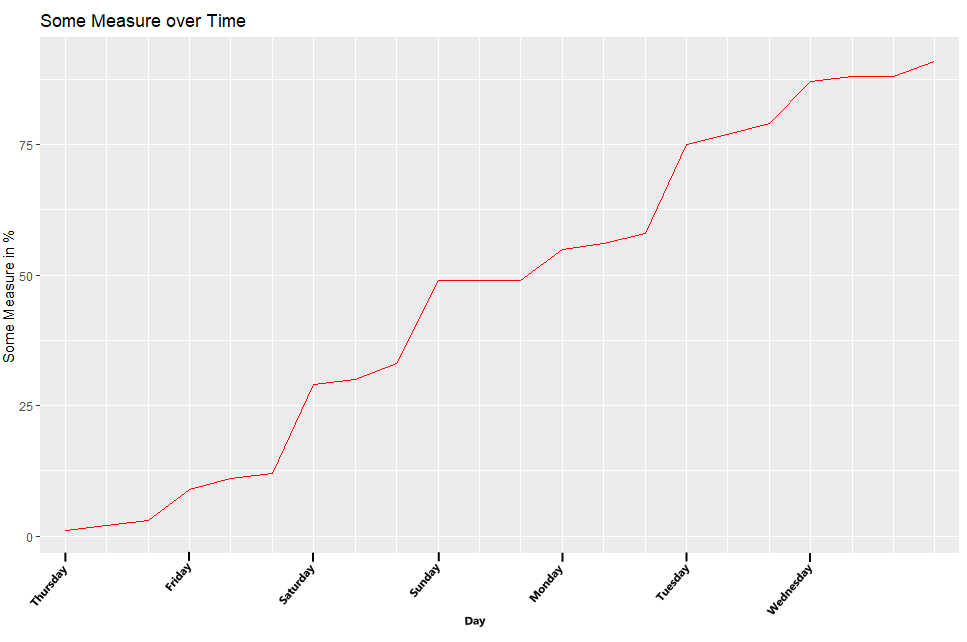
What I want is to have the individual unique weekdays show on the x-axis like this, as if I would plot the days as individual categories but only show the first one of each day. I cannot really hardcode this, because I am working with different participants, days and value amounts per day.

Expected Outcome: Desired Outcome

So I created a new variable with the weekdays:

df$day <- weekdays(as.Date(df$date, '%d-%m-%Y'))

enter image description here

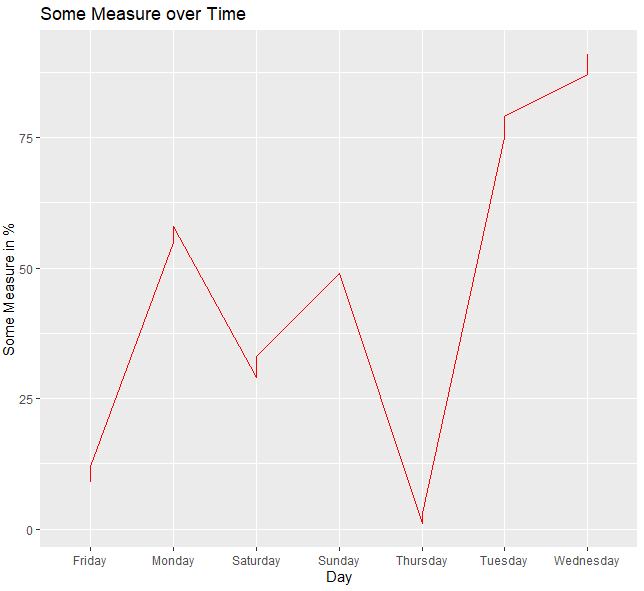
However, when I want to use this column as the x-axis variable, The days are not in the right order, and all values of one day obviously get plotted on top of each day:

geom_line(data = df, aes(x = day, y = value, group = 1), color = "red")

enter image description here

I have seen this being somewhat solved in python: Visualizing Time Series Data

However, I really want to use R and Markdown to create automated participant reports. If this is easier to accomplish with another plotting function in R, I am open ears. I just like the customizability of ggplot.

I hope my example is clear. I guess this can be solved with the right ggplot() parameters and settings. Does anyone have a solution for ending up with something more like the expected outcome montage?

$\endgroup$

1 Answer 1

1
$\begingroup$

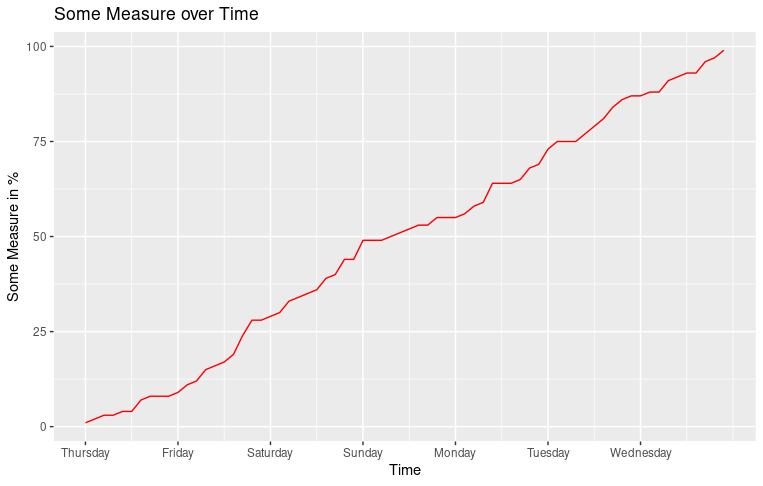
Would something like this work? I simply add an extra column that indicates the row number (which is later used as the x-axis) to make sure all values are displayed as a new point instead of plotting on top of each other for the same day. I then specifiy the custom x ticks and labels by selecting the first row for each day and get the row number (which specifies where the ticks and labels have to be drawn) and the day name (which specifies what the labels should display).

library(readr)
library(ggplot2)

df <- read_csv("testData.csv") %>%
  mutate(
    date = as.Date(date, "%d-%m-%Y"),
    day = weekdays(date),
    row = row_number()
)
ticks <- df %>% group_by(day) %>% filter(row_number() == 1) %>% select(row)

ggplot() +
  geom_line(data = df, aes(x = row, y = value, group = 1), color = "red") +
  ggtitle("Some Measure over Time") +
  xlab("Time") +
  ylab("Some Measure in %") + 
  scale_x_continuous(breaks=pull(ticks, row), labels=pull(ticks, day))

enter image description here

$\endgroup$
4
  • $\begingroup$ This looks exactly like what I need. I will try to implement it tomorrow and accept your answer here. Thanks for the suggestion. $\endgroup$
    – Livingsten
    Commented Apr 14, 2021 at 21:00
  • $\begingroup$ It works well, as long as the measurements are not done on two consecutive weekdays with the same name. Lets say the measurements are done on Monday, Tuesday, Wednesday, Thursday, Friday, Saturday, Sunday, and another Monday. Then the second Monday is not shown in the plot, as it is grouped to the first Monday. $\endgroup$
    – Livingsten
    Commented Apr 15, 2021 at 8:31
  • $\begingroup$ That should be relatively easy to fix, instead of using day in the group_by for the ticks, simply use the date column since that should be different for the first and second Monday. $\endgroup$
    – Oxbowerce
    Commented Apr 15, 2021 at 8:52
  • $\begingroup$ Great. It works well. Thank you so much. :) $\endgroup$
    – Livingsten
    Commented Apr 15, 2021 at 9:19

Your Answer

By clicking “Post Your Answer”, you agree to our terms of service and acknowledge you have read our privacy policy.

Not the answer you're looking for? Browse other questions tagged or ask your own question.