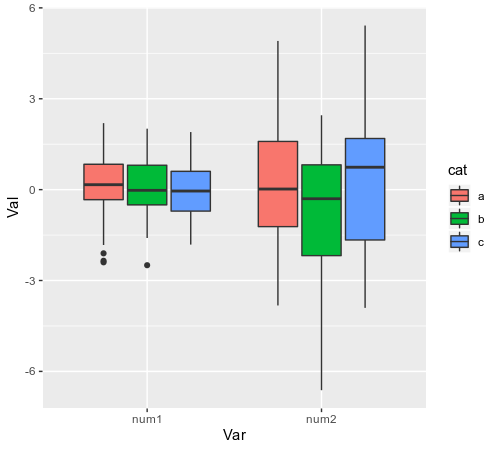
If I understand right your question, you are looking to plot selected numerical columns against a selected categorical column of your dataset, am I right ?
If so, you can have the use of dplyr, tidyr and ggplot2 packages to achieve this.
Starting with this dataframe:
  id        num1      num2      num3 cat cat2
1  C -0.48892284  1.417909 2.8884577   a    f
2  C -0.62795166  1.472390 1.6625688   c    f
3  B -0.04691673  2.731553 0.9692889   c    e
4  B  0.16261812 -1.152528 2.4308332   a    d
5  C  1.29230591 -1.609465 2.2089074   a    f
6  E -0.46355650 -1.070132 0.4517597   b    f
Basically, you are selecting first your columns of interest (here num1, num2 and cat), then, you reshape data into a longer format using pivot_longer function to obtain something like that:
library(tidyr)
library(dplyr)
df %>% select(id, num1, num2, cat) %>%
  pivot_longer(., cols = c(num1,num2), names_to = "Var", values_to = "Val")

# A tibble: 200 x 4
   id    cat   Var       Val
   <fct> <fct> <chr>   <dbl>
 1 C     a     num1  -0.489
 2 C     a     num2   1.42
 3 C     c     num1  -0.628
 4 C     c     num2   1.47
 5 B     c     num1  -0.0469
 6 B     c     num2   2.73
 7 B     a     num1   0.163
 8 B     a     num2  -1.15
 9 C     a     num1   1.29
10 C     a     num2  -1.61
# … with 190 more rows
Finally, you can add to this pipe sequence the plotting part by calling ggplot and geom_boxplot :
library(tidyr)
library(dplyr)
library(ggplot2)
df %>% select(id, num1, num2, cat) %>%
  pivot_longer(., cols = c(num1,num2), names_to = "Var", values_to = "Val") %>%
  ggplot(aes(x = Var, y = Val, fill = cat)) +
  geom_boxplot()

Is it what you are looking for ?
Data
set.seed(123)
id <- sample(LETTERS[1:5],100, replace = TRUE)
num1 <- rnorm(100)
num2 <- rnorm(100)*2
num3 <- rnorm(100)+2
cat <- sample(letters[1:3],100, replace = TRUE)
cat2 <- sample(letters[4:6],100, replace = TRUE)
df <- data.frame(id, num1, num2,num3, cat,cat2)

