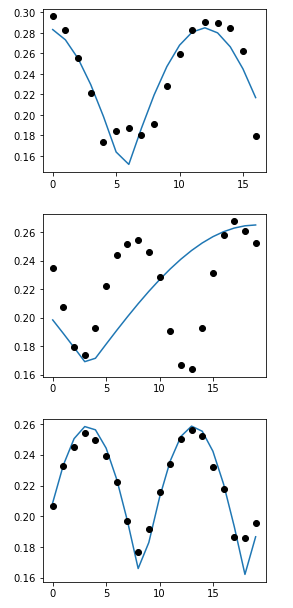
I want to fit a a * abs(sin(b*x - c)) + d function for each of the following data. In most of the cases I'm able to get decent accuracy. But for some cases, I'm not able to fit the equation on the data.
Data: 20_22, 23_25, 25_27, 27_30, 30_32, 32_34
My code:
from scipy import optimize
import numpy as np
import pandas as pd
import matplotlib.pyplot as plt

def fit_func(x, a, b, c, d):
    return a * np.abs(np.sin(b*x - c)) + d

cols = [chr(i) for i in range(97,123)]
data_25_27 = pd.read_csv('30_32.csv', names=cols, engine='python').fillna(0).values
for d in data_25_27:
    d = d[d != 0]
    d =  d / np.sqrt(np.sum(d**2))

    plt.figure(1, figsize=(4, 3))
    plt.clf()
    plt.scatter(range(d.shape[0]), d , color='black', zorder=20, label='Data')
    params, params_covariance = optimize.curve_fit(fit_func, range(d.shape[0]), d, bounds=([0.1, 0.1, 0, 0.1], [0.5, 0.4, 20, 0.5]))
    plt.plot(range(d.shape[0]), fit_func(range(d.shape[0]), params[0], params[1], params[2], params[3]), label='Fitted function')
    plt.show()
Here, is a sample output from above:
As one can see, the second data is not correctly fitted.

