I have a dataset in following structure inserted in a CSV file:
Banana  Water   Rice
Rice    Water
Bread   Banana  Juice
Each row indicates a collection of items that were purchased together. For example, the first row denotes that the items Banana, Water, and Rice were purchased together.
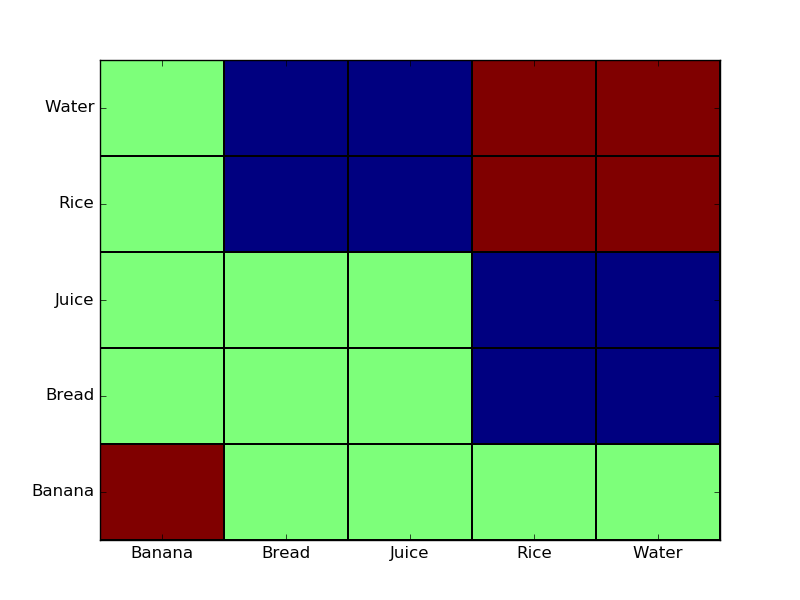
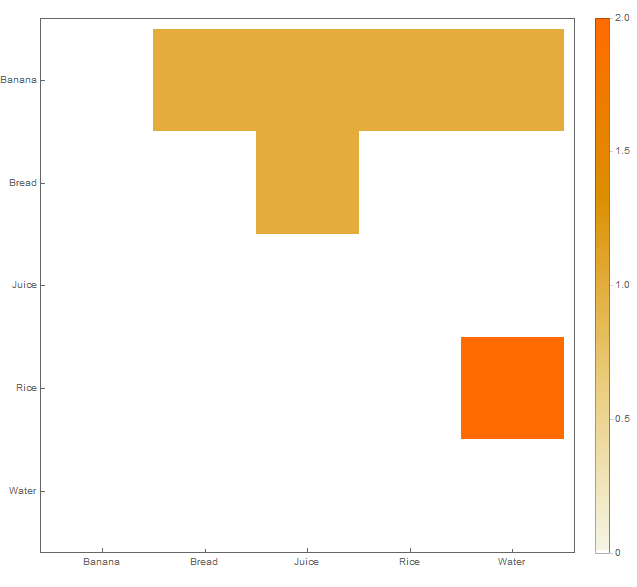
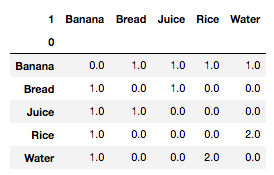
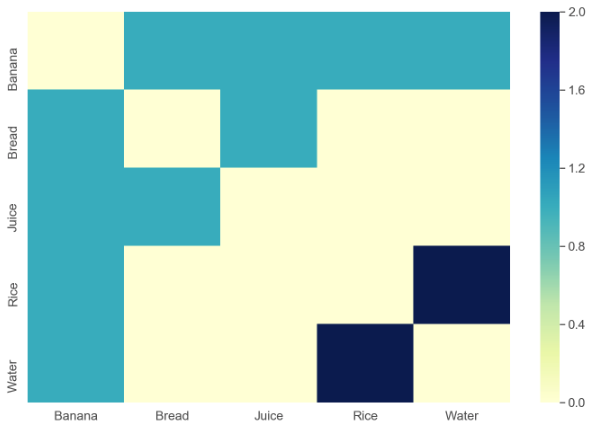
I want to create a visualization like the following:
This is basically a grid chart but I need some tool (maybe Python or R) that can read the input structure and produce a chart like the above as output.


