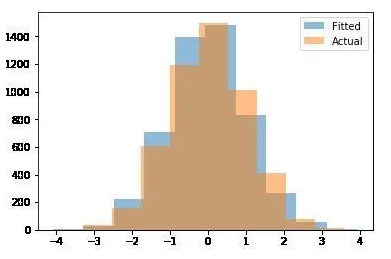
I have done some statistical distributions on real-world data. The distribution fitting gives me the below results (lognormal fits the best on data based on chi-squared test):
Best Distribution fits with parameters:
---------------------------------------

Distribution: lognorm
Parameters: (0.5921510072108613, -0.006454418407435666, 0.021090953536473916)

Distribution: expon
Parameters: (2e-06, 0.018877666177431276)

Distribution: pareto
Parameters: (11.057961210885452, -0.20440106940633995, 0.20436985884797232)
Here, i want to achieve two things:
Using the best parameters,how to generate the new synthetic data that represent our original data?. Does the rvs method in python is useful?
Compare the actual and generated data distribution fitting as shown in below figure.

