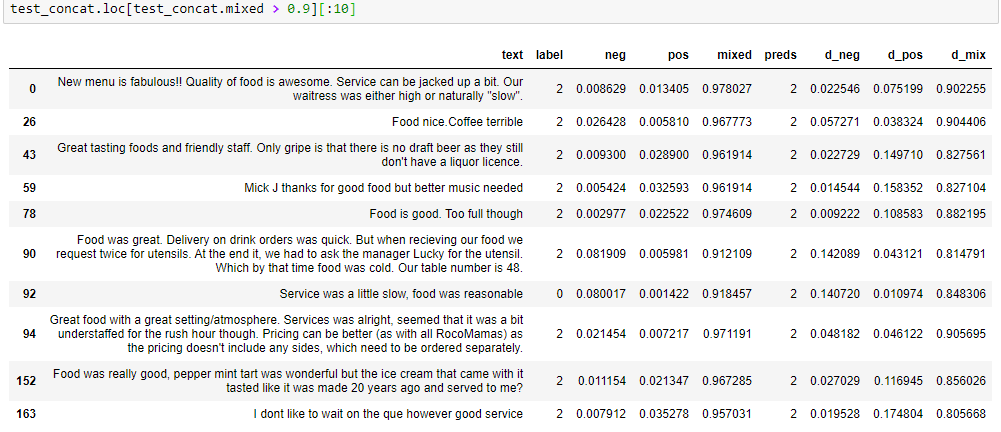
The results seem quite reasonable to me, but I cannot be sure based on your given information. In your table of results, you have shown 10 instances where the uncalibrated probability for the mixed class is between 0.97 and 0.99. It means that on average one would expect only about 2% of misclassifications on these instances. In the small sample that you are showing, the misclassification rate is 10% (1 out of 10), since one of the instances has the negative label. Maybe you have chosen these 10 instances randomly, and actually in most other samples of size 10 there would be 2 or 3 misclassified instances? If that is true, then 70% or 80% probability would indeed be better calibrated.
Looking at the misclassified instance, however, I am not sure whether the negative label is even correct for it? Maybe it should be mixed as well? So maybe there are labelling errors also in the data? Calibration is taking the labels as the ground truth, so if your model's predictions are even better than the labels, then the confidence is still reduced, because calibration is trusting the labels.
The above was my short answer, but below I will try to interpret your figures in more detail.
In your task, you have 3 classes: positive, negative, and mixed. In an attempt to make it easier to follow my answer, let me first give names to your figures:
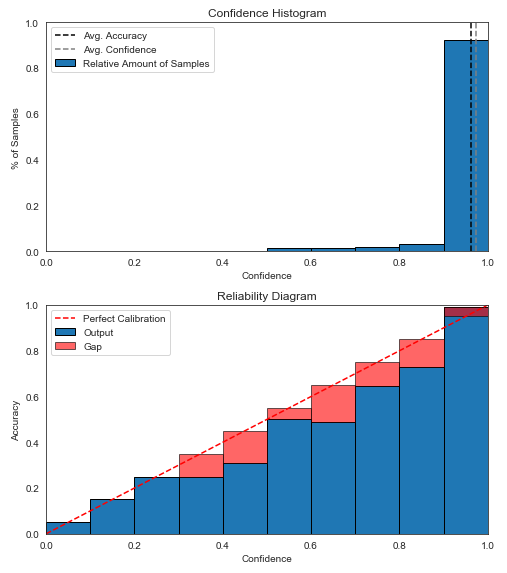
- Figure 1a - confidence histogram of uncalibrated predictions;
- Figure 1b - confidence-reliability diagram of uncalibrated predictions;
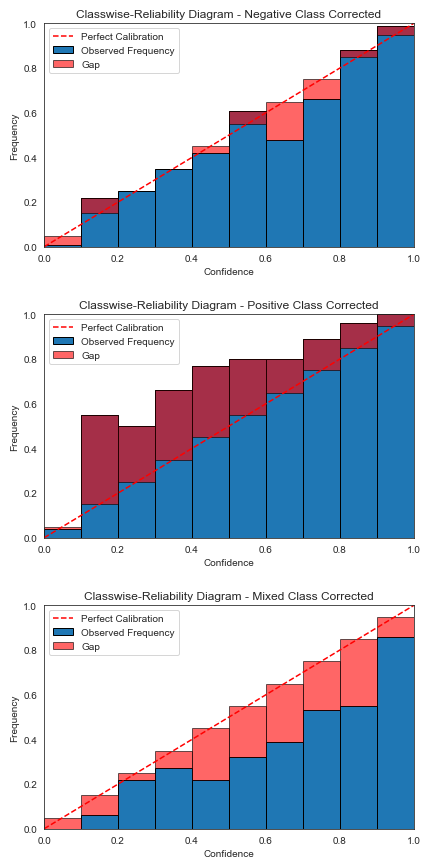
- Figures 2a, 2b, 2c - classwise-reliability diagrams of uncalibrated predictions for classes Neg, Pos, Mixed;
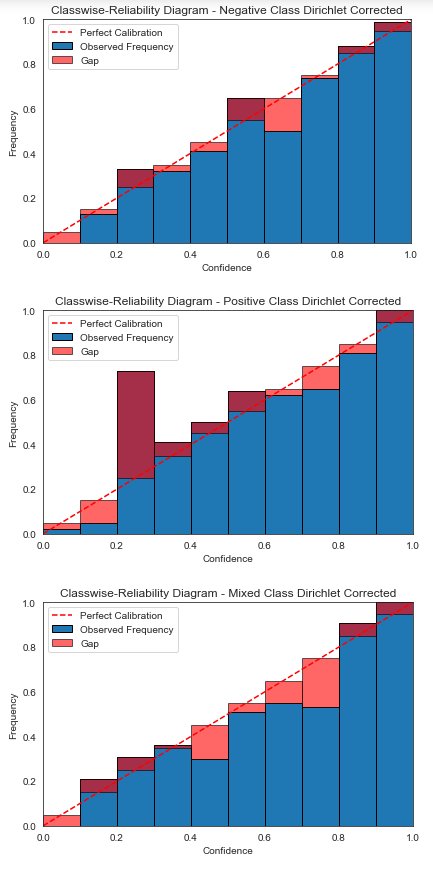
- Figures 3a, 3b, 3c - classwise-reliability diagrams of Dirichlet-calibrated predictions for classes Neg, Pos, Mixed;
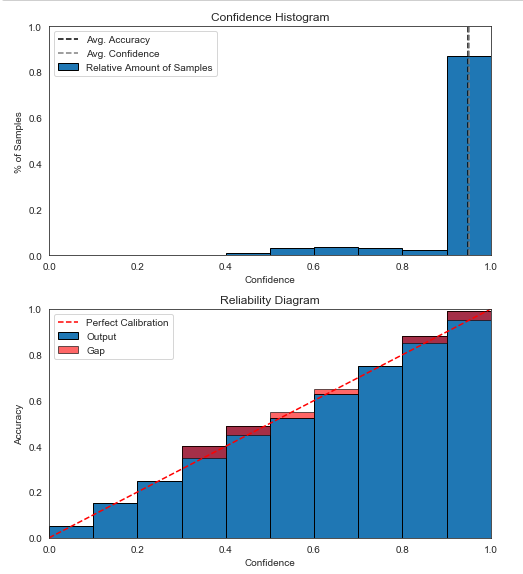
- Figure 4a - confidence histogram of Dirichlet-calibrated predictions;
- Figure 4b - confidence-reliability diagram of Dirichlet-calibrated predictions.
Fig. 1a shows that the vast majority of predictions have confidence above 0.9. Fig. 1b shows that in the highest-confidence bin (0.9 and above) there is a tiny bit of under-confidence, as the blue bar (actual accuracy within this bin) seems to be higher than the predicted (above the diagonal) - this is indicated by the red gap color mixing with the blue actual color to obtain dark red. Since the gap is small, the predictions seem quite well confidence-calibrated.
However, looking at the classwise-reliability diagrams it can be seen that the negative class is quite well-calibrated (Fig. 2a), whereas the positive class predictions are under-confident (Fig. 2b), and the mixed class predictions are under-confident (Fig. 2c). Figures 3a, 3b, 3c show that after applying the Dirichlet calibration, the probabilities are better classwise-calibrated.
The confidence-reliability diagram in Fig. 4b shows better calibration in the lower confidence bins, compared to Fig. 1b. However, most of the predictions are still in the highest confidence bin with confidence above 0.9 (Fig. 1a). In that bin, there is perhaps a tiny bit more under-confidence than before calibration. A possible explanation for this is that the reduction of loss in lower bins is more than the tiny increase of loss in the highest bin.
Based on the diagrams and table of results alone I cannot be sure whether Dirichlet calibration has been applied correctly, but it is possible that everything is correct. There seems to be improvement in classwise calibration and probably in confidence calibration also. I can try to interpret the results further, if you could give more information:
- the classwise histograms of class probability to go with figures 2 and 3;
- the learned parameter values for Dirichlet calibration;
- size of the dataset on which you calibrate and on which you show the reliability diagrams, and perhaps the class distribution as well.
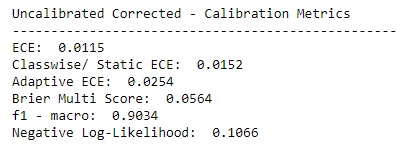
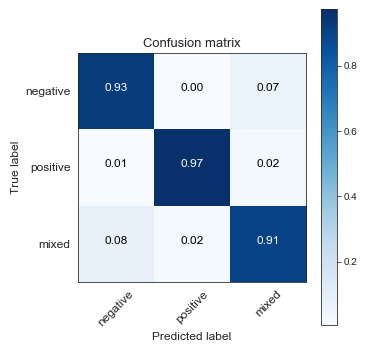
Here are some more thoughts based on the confusion matrices and numeric results for evaluation measures that were added to the question after my above answer.
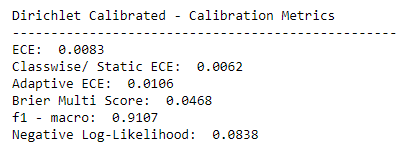
I don't think that the original model was already calibrated, given your reported numeric evaluation information and the classwise calibration plots. Dirichlet calibration has certainly improved calibration.
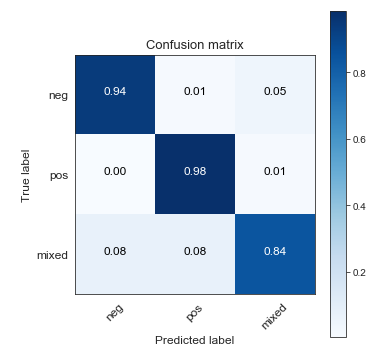
It seems that all the measures are improving applying after Dirichlet calibration, with the single exception being the accuracy on the mixed class. I can think of two reasons for this, which probably together result in this effect.
First, the classes are imbalanced, and thus 1% of increase in accuracy for the majority class is for the classifier and for the calibrator worth more than 1% decrease in accuracy for the minority class. You haven't specified your exact class distribution, but for example, if there is more than 3.5 times difference in size of positive and negative classes vs the mixed class, then increase of 1% both in positive and negative class accuracy is worth more than 7% (3.5%+3.5%) decrease in the mixed class accuracy. Well, Dirichlet calibration is optimising log-loss rather than accuracy, but the point remains roughly the same.
Second, there are misclassified instances in the validation set. This forces the calibrator to lower the confidence, as discussed in my earlier answer above.
Maybe there are further factors relating to different distributions of confidences for different classes. This could be checked if you would provide the histograms of predicted class probabilities for each class separately (maybe both before and after calibration).
If you are particularly interested in having a better accuracy in the mixed class, then you need to upweight the mixed class during calibration. Ideally, calibration should not push towards the overall class distribution, but to some extent this can happen due to the limitations of parametric modelling. I suggest you to try oversampling the mixed class to be of the same size as the positive and negative classes during calibration.

