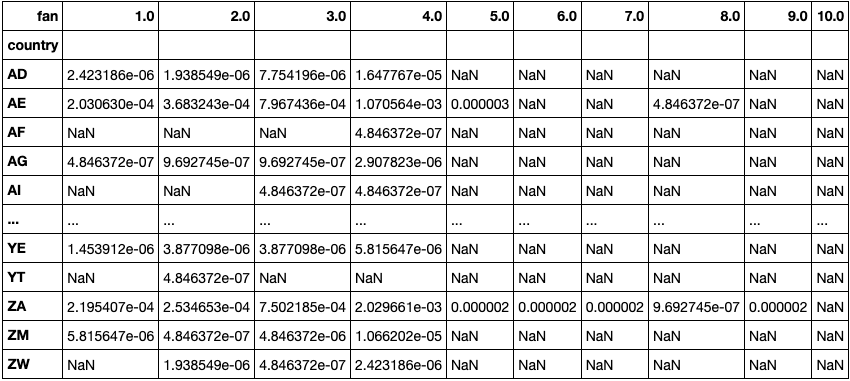
I have a data frame like below:-
Here I have 194 countries and the columns are fan_out values which is in percent of the total population.
Like for country AD, the total fan_out value is 2.24 -06 % of the total population.
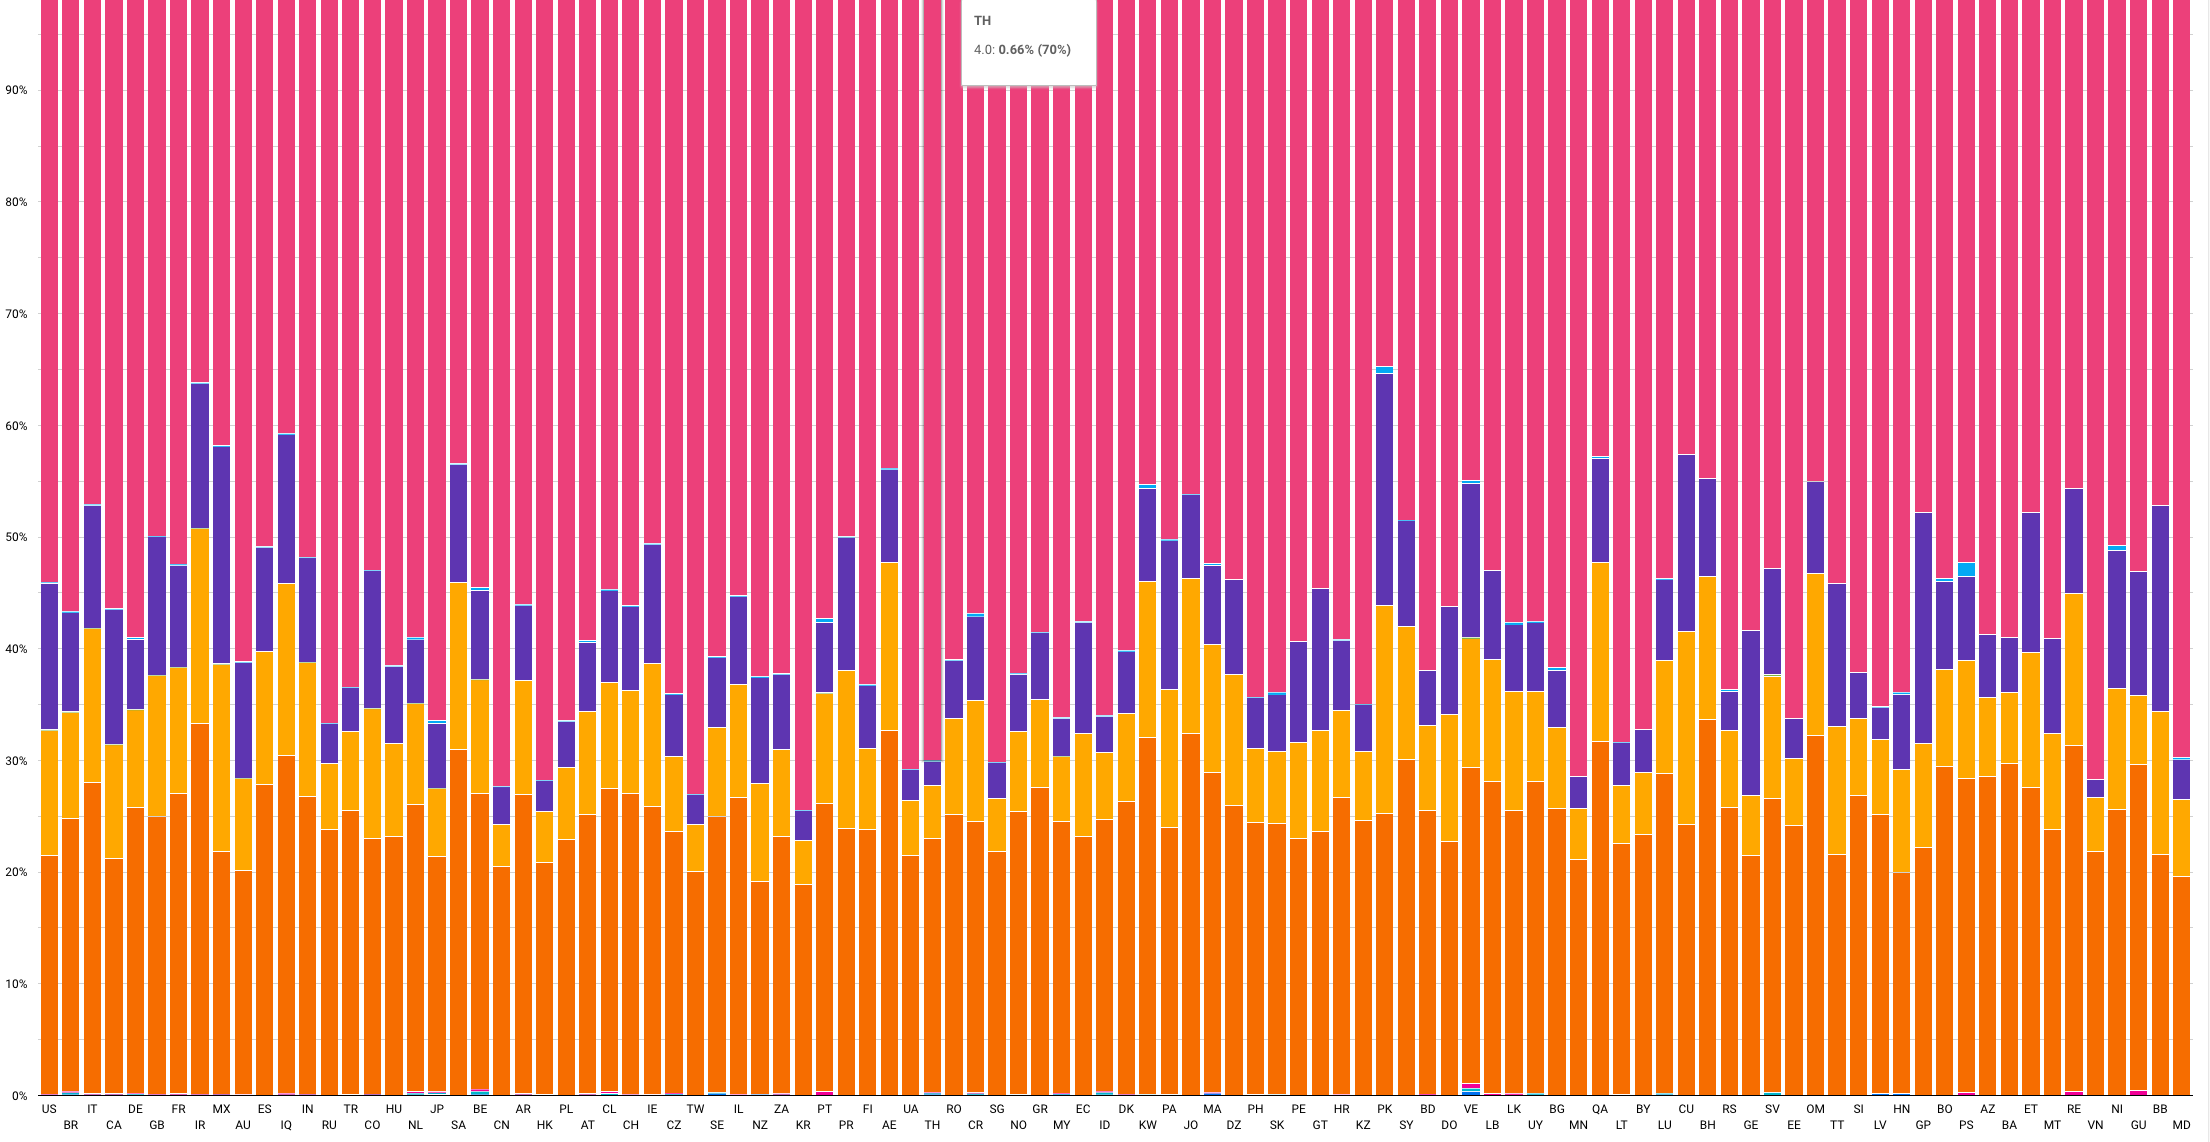
I tried a stacked chart like below:-
The only issue is it's not presentable because the fan_out value for 5,6 or 7 is very small are not clearly seen.
Is there any way I can build a cluster to make sense of this that?
My only question is how to represent this data in one graph to make more sense like finding clusters or a pattern or even I can apply any ML algorithm to find any pattern.


