0
$\begingroup$

I'm having an issue where my AutoML model's output is having a consistent offset from the test dataset (image below). I'm wondering if anybody has any input on what could be causing this? My initial thought is that it's an elevation related issue. The predictors are from weather models and the dependent variables are from station data. The weather models have a slightly different elevation than some of the stations' recorded elevations as the models go off of a grid. sample output chart
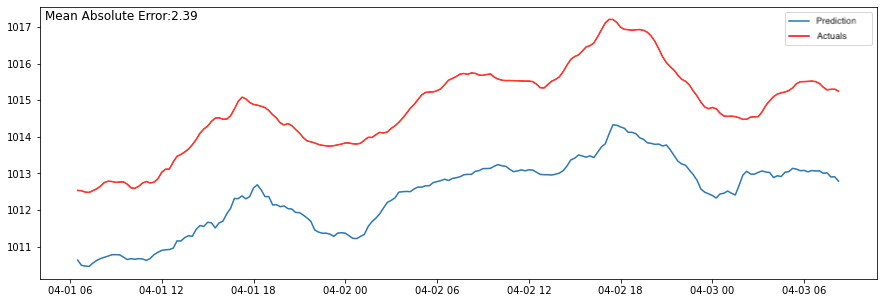
I'm using auto-sklearn and the model input can be simulated by the following simplified matrix: \begin{bmatrix}Temp_{loc1,\ time1}&Wind_{loc1,\ time1}&Temp_{loc2,\ time1}&Wind_{loc2,\ time1} \\ Temp_{loc1,\ time2}&Wind_{loc1,\ time2}&Temp_{loc2,\ time2}&Wind_{loc2,\ time2} \\ Temp_{loc1,\ time3}&Wind_{loc1,\ time3}&Temp_{loc2,\ time3}&Wind_{loc2,\ time3}\end{bmatrix}

And the output is: \begin{bmatrix}Pressure_{loc1,\ time1}&Pressure_{loc2,\ time1} \\ Pressure_{loc1,\ time2}&Pressure_{loc2,\ time2} \\ Pressure_{loc1,\ time3}&Pressure_{loc2,\ time3}\end{bmatrix}

I've tried including elevation in the predictor matrix, but it did not do anything to change the output (I'm guessing because it's a constant?) I'm just curious if anyone has any suggestions, or sees something I don't? Ideally I'd like to solve this problem before the output happens as I don't want to do a post-process downscale method to adjust the output.

$\endgroup$
4
  • $\begingroup$ Could you elaborate on "The weather models have a slightly different elevation than some of the stations' recorded elevations as the models go off of a grid."? Did you mean "dependent" variables are based on station? What kind of models does the autosklearn test, and which is selected? Are you reporting scores on a test set, and if so how is that generated? $\endgroup$
    – Ben Reiniger
    Commented Aug 26, 2022 at 16:37
  • $\begingroup$ Yes, so for loc 1 i'm trying to predict the surface pressure. I use station data as truth and model data as the predictors. So at the station, a single point, the elevation is recorded as 50 m. The weather model is on a grid of 0.50 degrees, for simplicity let's say it uses a grid area average for elevation. So for the grid point that contains the station, the elevation could be as high as 100 m or as low as 0 m. Whoops I did mean dependent variables are the station data, i'll fix that. $\endgroup$
    – JWB
    Commented Aug 26, 2022 at 18:17
  • $\begingroup$ Right now I don't have any limitations on the models the autosklearn tests. It seems to prefer RF and GB though. Yes, the scores are reported on a test set. I've set it up manually by using the model to predict the station data, then I match the actual station data with that to calculate MAE, some threshold stats, and make charts. $\endgroup$
    – JWB
    Commented Aug 26, 2022 at 18:17
  • $\begingroup$ If you use a different resampling_strategy, do you see the same effect? $\endgroup$
    – rickhg12hs
    Commented Aug 27, 2022 at 6:43

1 Answer 1

2
$\begingroup$

Given the relationship between temperature, pressure and volume, your theory about elevation differences might be valid. Altitude of course affects those measurements.

Scaling

Are you scaling your inputs to be between [0, 1]? If you do so using the sklearn StandardScaler (or equivalent scale function), you will keep the distribution of your data, but at least the scale is then brought into the same range for all your data.

You apply the transformation to the predictions to move them back into the target range (see linked documentation above).

Simplification

Perhaps you could first train a model only on ${\{Temp,Wind,Pressure\}}_{loc1}$ data first, to rule effects between the two locations.

Visualisation

If the above don't help, I would suggest plotting some of the input data to see if there are clear correlations or consistent differences that might affect your model. You can then try to account for these somehow (scaling, subtracting them, etc).

I don't know which class of model you are using (not familiar with auto-sklearn model selection), but you might consider using a model such as a neural network that would likely learn to compensate for the bias you are seeing.

$\endgroup$

Your Answer

By clicking “Post Your Answer”, you agree to our terms of service and acknowledge you have read our privacy policy.

Not the answer you're looking for? Browse other questions tagged or ask your own question.