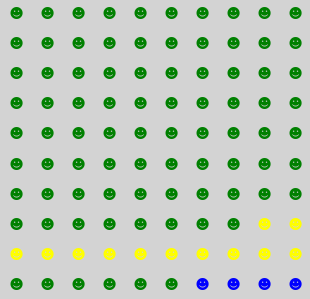
I really like how this visualization represents the survey participants.
Is any tool for that? (Or R/python library?)
My go to library would be matplotlib, with which it is relatively easy to generate something similar.
I don't have the correct font family to render the exact output as above, but this hopefully illustrates the point

Source Code
import pandas as pd
import numpy as np
import matplotlib.pyplot as plt


# Create the data to plot on
# create a 2d array of evenly-spaced points on a grid
xy_range = np.arange(10.)
data = pd.DataFrame([[x, y] for x in xy_range for y in xy_range], columns=['X', 'Y'])

# color the points
# all green first and then with exceptions
data['color'] = 'green'
data.loc[(data['X']>=0)&(data['Y']==1), 'color'] = 'yellow'
data.loc[(data['X']>=8)&(data['Y']==2), 'color'] = 'yellow'
data.loc[(data['X']>=6)&(data['Y']==0), 'color'] = 'blue'

# We'll use this to calculate axis fractions
max_x = data['X'].max()
max_y = data['Y'].max()

fig, currAX = plt.subplots(figsize=(5,5), facecolor='lightgray')

# plot/mark each point as an annotation
# we do this so we can get a custom emoji instead a marker
for x0, y0, color in zip(data['X'], data['Y'], data['color']):
    plt.annotate(s=u'\u263B', xy=(x0/max_x, y0/max_y), fontname='STIXGeneral', color=color, size=15, ha='center', va='center')

# clear the axis lables, ticks, and lines
currAX.get_xaxis().set_visible(False)
currAX.get_yaxis().set_visible(False)
plt.axis('off')

plt.show();
With Wolfram Language you may use "Icon" Entity and ConstantArray to create lists of "Crayola" ColorData colored icons and display with Multicolumn 24 columns wide.
palette = <|"SeaGreen" -> 135, "Razzmatazz" -> 146, "Yellow" -> 18, "TurquoiseBlue" -> 13|>;
Multicolumn[
 Flatten@
  KeyValueMap[
    With[{i =
        Graphics[{ColorData["Crayola", #1], List @@ Entity["Icon", "MensRoom"]["Image"]},
         Background -> Black,
         ImageSize -> 12]
       },
      ConstantArray[i, #2]
      ] &
    ]@palette,
 24,
 Spacings -> .2,
 Frame -> True,
 FrameStyle -> Directive[Thickness[3], Black],
 Background -> Black,
 Appearance -> "Horizontal"
 ]
The above can be generalised into a function that takes an Association of colours to number of icons, a set of graphics primitives for the icon (icons are FilledCurves), and some additional display parameters.
ClearAll[iconChart]
Options[iconChart] = {Options[Multicolumn], Options[Graphics]};
SetOptions[iconChart,
  {
   Background -> Black,
   ImageSize -> 12,
   Spacings -> .2,
   Frame -> True,
   FrameStyle -> Directive[Thickness[3], Black],
   Appearance -> "Horizontal"
   }];
iconChart[pallet_, icon_, columns_, opts : OptionsPattern[iconChart]] :=
 Multicolumn[
  Flatten@
   KeyValueMap[
     With[{i =
         Graphics[{#1, icon},
          Frame -> None,
          FilterRules[{opts, Options[iconChart]}, Options[Graphics]]]
        },
       ConstantArray[i, #2]
       ] &
     ]@pallet,
  columns,
  FilterRules[{opts, Options[iconChart]}, {Options[Multicolumn]}]
  ]
Then the above can be charted with
iconChart[
 <|
  ColorData["Crayola", "SeaGreen"] -> 135,
  ColorData["Crayola", "Razzmatazz"] -> 146,
  ColorData["Crayola", "Yellow"] -> 18,
  ColorData["Crayola", "TurquoiseBlue"] -> 13
  |> ,
 List @@ Entity["Icon", "MensRoom"]["Image"],
 24
]
Adding random colour and icon selection generates a different chart on each evaluation.
iconChart[
 AssociationThread[
  RandomSample[
   Values@KeyDrop["Black"]@ColorData["Crayola", "ColorRules"], 5],
  RandomInteger[{3, 15}, 5]
  ],
 List @@ RandomEntity["Icon"]["Image"],
 10,
 ImageSize -> 30]
For example,
and so on.
Hope this helps.
These are called Waffle Chart. A Waffle Chart is a gripping visualization technique that is normally created to display progress towards goals. A waffle chart shows progress towards a target or a completion percentage. There is a grid of small cells, of which coloured cells represent the data. A chart can consist of one category or several categories. Multiple waffle charts can be put together to show a comparison between different charts.
PyWaffle is an open source, MIT-licensed Python package for plotting waffle charts.
It provides a Figure constructor class Waffle, which could be passed to matplotlib.pyplot.figure and generates a matplotlib Figure object.
Some examples:
Plot with Icons - Pictogram Chart
data = {'Democratic': 48, 'Republican': 46, 'Libertarian': 3}
fig = plt.figure(
    FigureClass=Waffle,
    rows=5,
    values=data,
    colors=["#232066", "#983D3D", "#DCB732"],
    legend={'loc': 'upper left', 'bbox_to_anchor': (1, 1)},
    icons='child',
    font_size=12,
    icon_legend=True
)
plt.show()
Multiple Plots in One Chart
import pandas as pd
data = pd.DataFrame(
    {
        'labels': ['Hillary Clinton', 'Donald Trump', 'Others'],
        'Virginia': [1981473, 1769443, 233715],
        'Maryland': [1677928, 943169, 160349],
        'West Virginia': [188794, 489371, 36258],
    },
).set_index('labels')

# A glance of the data:
#                  Maryland  Virginia  West Virginia
# labels
# Hillary Clinton   1677928   1981473         188794
# Donald Trump       943169   1769443         489371
# Others             160349    233715          36258


fig = plt.figure(
    FigureClass=Waffle,
    plots={
        '311': {
            'values': data['Virginia'] / 30000,
            'labels': [f"{k} ({v})" for k, v in data['Virginia'].items()],
            'legend': {'loc': 'upper left', 'bbox_to_anchor': (1.05, 1), 'fontsize': 8},
            'title': {'label': '2016 Virginia Presidential Election Results', 'loc': 'left'}
        },
        '312': {
            'values': data['Maryland'] / 30000,
            'labels': [f"{k} ({v})" for k, v in data['Maryland'].items()],
            'legend': {'loc': 'upper left', 'bbox_to_anchor': (1.2, 1), 'fontsize': 8},
            'title': {'label': '2016 Maryland Presidential Election Results', 'loc': 'left'}
        },
        '313': {
            'values': data['West Virginia'] / 30000,
            'labels': [f"{k} ({v})" for k, v in data['West Virginia'].items()],
            'legend': {'loc': 'upper left', 'bbox_to_anchor': (1.3, 1), 'fontsize': 8},
            'title': {'label': '2016 West Virginia Presidential Election Results', 'loc': 'left'}
        },
    },
    rows=5,  # outside parameter applied to all subplots
    colors=["#2196f3", "#ff5252", "#999999"],  # outside parameter applied to all subplots
    figsize=(9, 5)
)
plt.show()
For more,