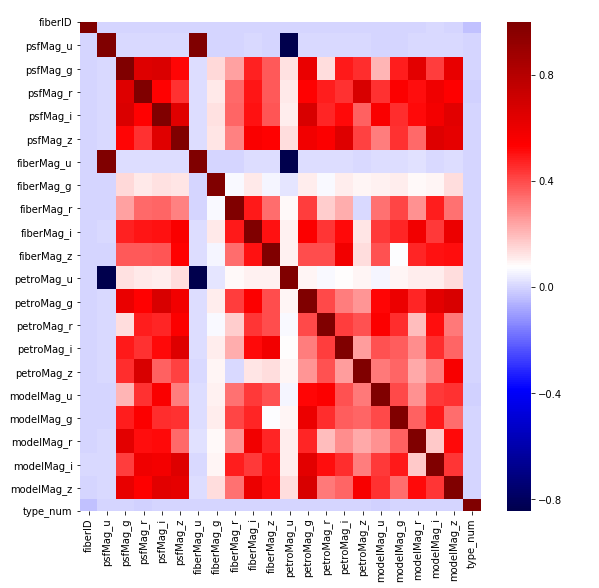
I want your help to analyze this correlation heat map
If you look at this heat map, what can you infer and what can you apply?
3 Answers
From this heatmap, you could infer the correlation between features, if they are positively correlated, negatively correlated, or not correlated at all. The intensity of the colors shows the correlation. Dark red, strongly positively correlated, i.e., if the value in one of the features increases, the value of the other feature increases as well. Dark blue indicates a negative correlation, i.e., if a value of one feature increases, the value of the other feature decreases. White refers to no correlation.
Hope that helps.
-
1$\begingroup$ thx if you apply this to the Randomforest,lgb or xgboost what whould you do? you would find any features to remove or something else? $\endgroup$– slowmonkCommented Feb 14, 2020 at 11:22
-
1$\begingroup$ @slowmonk based on the problem you have at hand, you decide this. Ideally when you do feature reduction, you end up removing highly correlated features. Do take a look at PCA and tsne for feature reduction. You would evalute your model with certain domain knowledge to drop certain features as a permutation combination approach. This could help your model to predict with better accuracy. $\endgroup$ Commented Feb 14, 2020 at 11:30
This sounds like a feature engineering exercise. Check the links below for relevant info.
Feature Selection Techniques in Machine Learning with Python | Towards Data Science
A Feature Selection Tool for Machine Learning in Python | Towards Data Science
And this last one, directly below, is probably the easiest to implement, and probably the best case for your scenario.
-
$\begingroup$ The last link is not working. $\endgroup$ Commented Mar 30, 2021 at 14:22
Looks like your features psfMag_u and fiberMag_u are highly correlated. Remove one of them. Also, psfMag_u and petroMag_u are negatively correlated. So you can get rid of one of them.
Other than that, nothing much can be deduced just from this graph.

