In Tableau, I commonly want to carry out a task like distinguishing 2 groups by various measures.
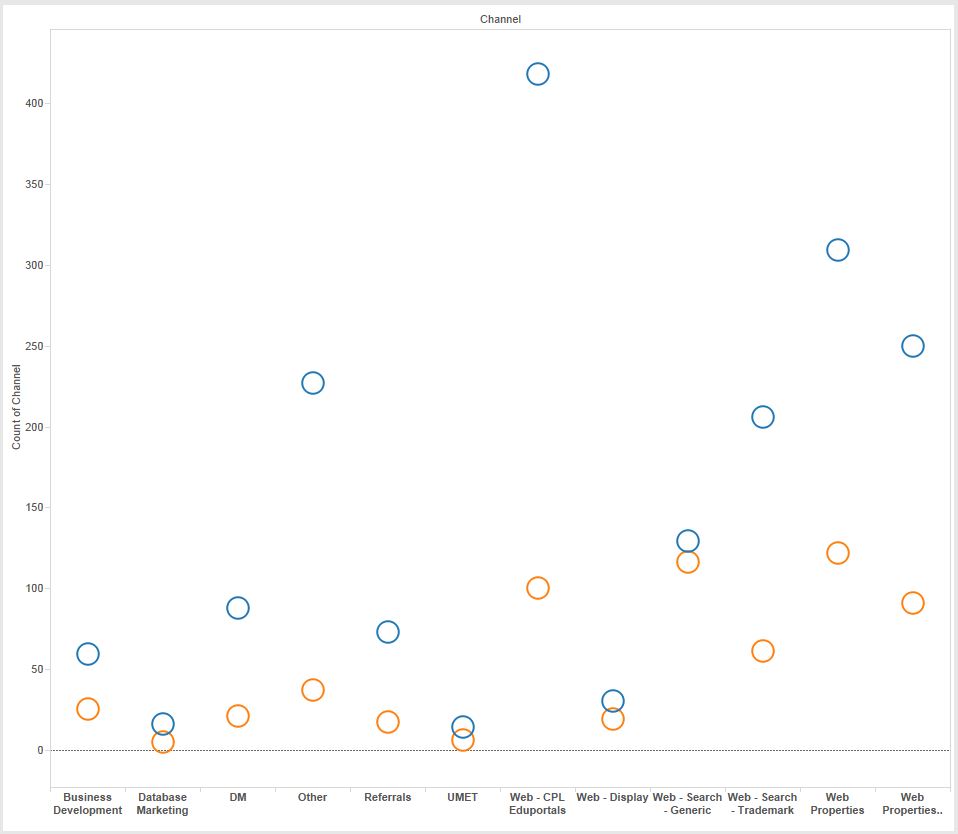
The example below shows the difference in the count of 2 treatment and control for variable levels of a factor (measure):
This view is misleading though, because the overall group sizes of treatment and control are not equal.
What I'd like to do is to represent this as a proportion for each levels of the factor (measure) instead of using just a count. For instance, perhaps 25% of the treatment group is in Business Development whereas only 10% of the control group is in Business Development.
Is this possible to do in Tableau, or does it strictly require pre-processing?

