1
$\begingroup$

I have the below data, I am looking for a effective visualization or graphical method (in Python) to understand how the err is distributed with respect to min and max.

Data_X_err.head()
Out[137]: 
     min    max   err
0  35435  35933  1.40
1  35155  36382  3.43
2  35305  36042  2.07
3  35216  36225  2.82
4  35196  36259  2.98

Thank you.

$\endgroup$

1 Answer 1

2
$\begingroup$

use matplotlib:

import matplotlib.pyplot as plt
%matplotlib inline
f, (ax1, ax2) = plt.subplots(1, 2)
ax1.plt(Data_X_err.min, Data_X_err.err)
ax2.plt(Data_X_err.max, Data_X_err.err)

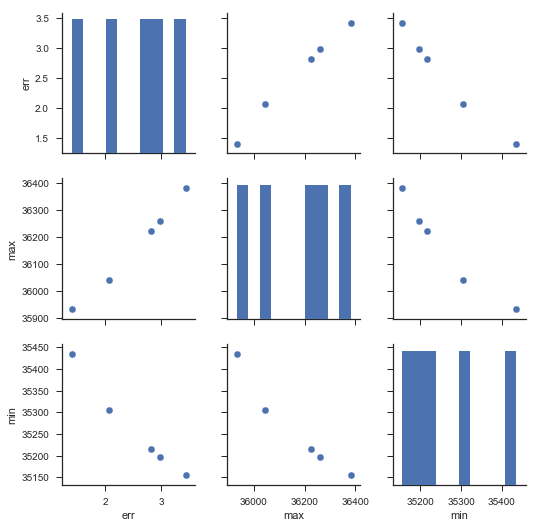
Alternatively you could use seaborn's pairplot

import seaborn as sns
%matplotlib inline
sns.set(style="ticks")

sns.pairplot(df)

enter image description here

$\endgroup$
0

Your Answer

By clicking “Post Your Answer”, you agree to our terms of service and acknowledge you have read our privacy policy.

Not the answer you're looking for? Browse other questions tagged or ask your own question.