1
$\begingroup$

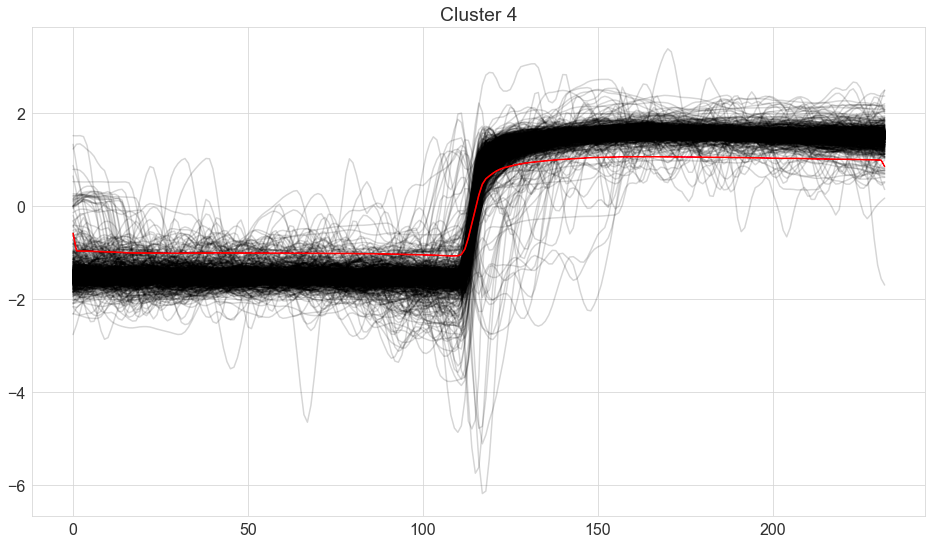
I am using tslearn KShape to cluster time series data. I am generally happy with the results, as upon inspection, the clusters seem to make sense because of the similarity in shape and magnitude. I can see the general shape that emerges as seen in the figures below.

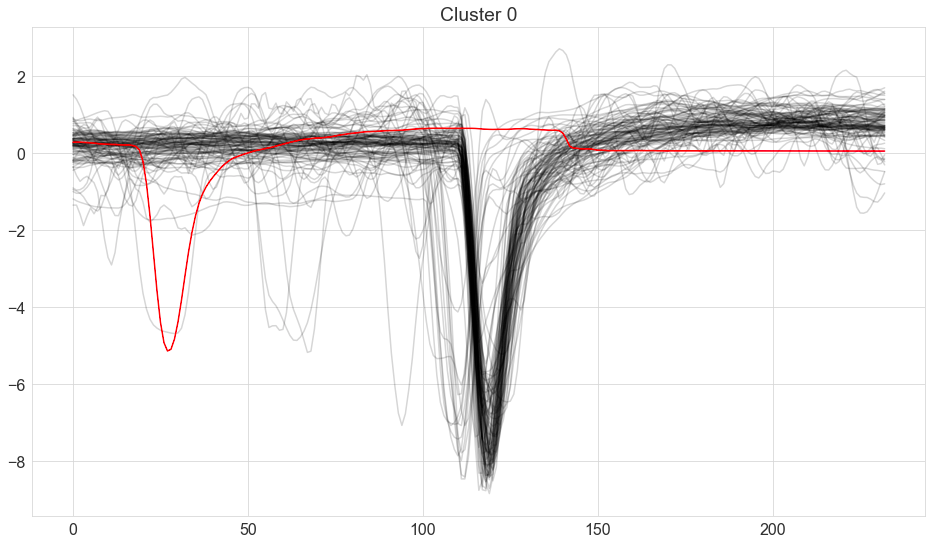
What I find odd is the cluster centers using k_shape.cluster_centers_. There seems to be a significant shift from some of the clusters. I've included two figures illustrating my point. In Cluster 0, the cluster center is plotted as the red line, and there is a significant shift from where that shape actually emerges in the time series. In Cluster 4, the cluster center is much more centered, for lack of a better term.

What could be contributing to the major offset seen in Cluster 0? What I find odd is that not all clusters have such a dramatic offset, and not all are offset to the beginning or the end of the time series. Any thoughts?

offset cluster center

png

$\endgroup$

3 Answers 3

0
$\begingroup$

It turns out that the red shape in each cluster indicates the cluster centroid, which is the shape that all the other shapes in the cluster are compared with. There is an offset occasionally because it's a centroid, and there may be a some variance within the cluster. For that reason, the standard deviation set in the k-shape algorithm can affect the centroid, with larger standard deviations contributing to less "exact" centroids.

$\endgroup$
0
$\begingroup$

There is definitely a bug in KShape where centroid shapes are shifted randomly: I get the centroid shapes shifted on my test data with 5 different profiles (with noise added) by: -4, -4, -11, -4, +11 periods on data with 48 periods. Total mess. Will see how to fix it under the hood.

$\endgroup$
0
$\begingroup$

Not so, at least not in v. 0.6.3. There is definitely a bug in KShape where centroid shapes are shifted randomly: I get the centroid shapes shifted on my test data with 5 different profiles that are all not random at all, with only minor noise added, by: -4, -1, -11, -1, +11 periods on data with 48 periods. Total mess.

$\endgroup$
1
  • $\begingroup$ Your answer could be improved with additional supporting information. Please edit to add further details, such as citations or documentation, so that others can confirm that your answer is correct. You can find more information on how to write good answers in the help center. $\endgroup$
    – Community Bot
    Commented May 13 at 4:28

Your Answer

By clicking “Post Your Answer”, you agree to our terms of service and acknowledge you have read our privacy policy.

Not the answer you're looking for? Browse other questions tagged or ask your own question.