Welcome to Data Science SE!
Well, we say that most of our jobs is to wrangle with data, and that is because data is usually trying to deceive us... jokes aside:
You have a missing data problem
that means your have to clean your data and fill those missing values. To perform this cleaning process your must take the most classic statistician inside of you and ask:
- Why is this data missing?
- How much data is missing?
There are many reasons for a specific information to be unavailable. This will demand you to make assumptions and decide how to deal with this.
Jeff Sauro posted at MeasuringU: 7 Ways to Handle Missing Data, some which I list here:
- Delete corrupted samples:
If you have a large dataset and there is not much data missing, you can simply remove those corrupted data points and go on with life
Some problems will allow you to go back and get missing information.
We usually ain't that lucky, then you can
Sometimes, you can infer what would be the feature value by simply looking their pears. That is a bit arbitrary but it might work.
This is the most common approach, simply use the average of that value whenever it is missing. This might artificially reduce your variance but so does using 0 or -9999... for every missing value.
You can use a multiple regression to infer the missing value from the available values for each candidate.
Some references on missing data are:
- Allison, Paul D. 2001. Missing Data. Sage University Papers
Series on Quantitative Applications in the Social Sciences.
Thousand Oaks: Sage.
- Enders, Craig. 2010. Applied Missing Data Analysis.
Guilford Press: New York.
- Little, Roderick J., Donald Rubin. 2002. Statistical Analysis
with Missing Data. John Wiley & Sons, Inc: Hoboken.
- Schafer, Joseph L., John W. Graham. 2002. “Missing Data:
Our View of the State of the Art.” Psychological Methods.
About your experiment:
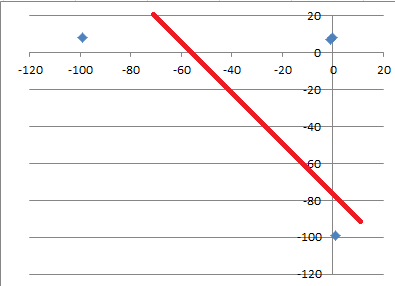
Adding -99... is creating outliers and that bit of information is heavy (numerically speaking, it is huge) and will affect parameter tuning. For example, suppose you have this data:
| Feature1 | Feature2 |
|----------|----------|
| 0        | 8        |
| -1       | 7        |
| 1        | -        |
| -        | 8        |
And you try filling the missing values with -99, now try to fit a linear regression trough the data. Can you see that you don't be able to fit it properly?

The line won't fit, and this will yield bad performance.
Adding 0 values on the other hand will give a slightly better line:

It is still not good, but slightly better since the scale of the parameters will be more realistic.
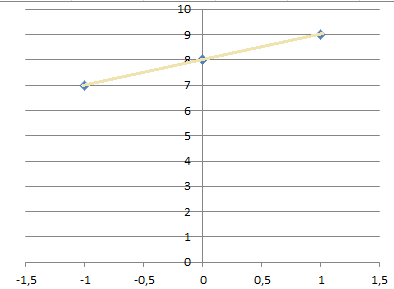
Now, using average, is this case will give you even better curve, but using regression will give you a perfect fitting line:

Note: I need to remake those images, but these should do until I have the time for it.


