0
$\begingroup$

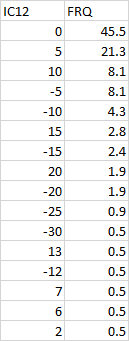
Hello folks, I am trying to plot a grouped bar plot of two variables with varying lengths, which means the x and y length of both the variables are different. The format of the data is given below: This is for NRI.

enter image description here

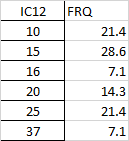
This is for RI.

enter image description here

I want these two datasets to be grouped together. When I try to plot it both the datasets are overlapping each other. If anyone can help me in this regard it will be much appreciated.

Here is the code I used:

import numpy as np
from mpl_toolkits.basemap import Basemap
import matplotlib.pyplot as plt
import matplotlib.path as mpath
from PIL import *
import os
import sys
import csv
from matplotlib import rc, rcParams
import pandas as pd
from matplotlib.ticker import (MultipleLocator, FormatStrFormatter,
                               AutoMinorLocator)
#df = pd.read_csv('E:/v.csv')
df = pd.read_excel('IC12_freq.xlsx',sheet_name='NRI')
df_1 = pd.read_excel('IC12_freq.xlsx',sheet_name='RI')


x = df.IC12.values
x1 = df_1.IC12.values
y = df.FRQ.values
y1 = df_1.FRQ.values
fig, ax = plt.subplots(figsize=(10,10))
ax.bar( x+1.3,y,color = 'w', width = 1.3,hatch='***',edgecolor='k',label='NRI',align='center')
#ax.twinx()
ax.bar( x1,y1,color = 'w', width = 1.3,hatch='/////',edgecolor='k',label='RI',align='center')
#ax.plot(x, y,'ro',color = 'k')
#ax.plot(x1, y1,'ro',color = 'r')
ax.xaxis.set_major_locator(MultipleLocator(10))
ax.xaxis.set_major_formatter(FormatStrFormatter('%d'))
ax.xaxis.set_minor_locator(MultipleLocator(5))
ax.xaxis.set_minor_formatter(FormatStrFormatter('%d'))
# For the minor ticks, use no labels; default NullFormatter.
ax.yaxis.set_major_locator(MultipleLocator(10))
ax.yaxis.set_major_formatter(FormatStrFormatter('%d'))
ax.yaxis.set_minor_locator(MultipleLocator(5))
ax.yaxis.set_minor_formatter(FormatStrFormatter('%d'))

plt.rcParams["font.weight"] = "bold"
axis_font = {'fontname':'Arial', 'size':'14'}
tick_font = {'fontname':'Arial', 'size':'5'}

ax.tick_params(which='both', width=2)
ax.tick_params(which='major', length=7)
ax.tick_params(which='minor', length=7)
plt.xlabel('IC12(kt)', fontweight='bold',**axis_font)
#plt.xticklabel(**tick_font)
plt.ylabel('Frequency(%)', fontweight='bold',**axis_font)
ax.set_facecolor("#f1f1f1")
ax.spines['top'].set_linewidth(1.5)
ax.spines['right'].set_linewidth(1.5)
ax.spines['bottom'].set_linewidth(1.5)
ax.spines['left'].set_linewidth(1.5)
leg = ax.legend()

#plt.grid(True)
#plt.style.use('ggplot')
##plt.xlabel("x axis", **axis_font)
#plt.ylabel("y axis", **axis_font)
#plt.bar(y,x)
#plt.savefig('IC12_frq.tif', bbox_inches='tight', dpi=300)
plt.show
$\endgroup$
4
  • $\begingroup$ Hi, can you show an image of the incorrect result you get, the code you tried, and any image from google that shows the kind of plot you want? That would make it much easier to help you $\endgroup$
    – A Kareem
    Commented May 10, 2020 at 12:09
  • 1
    $\begingroup$ I have uploaded the code I have used. Sorry, am not able to upload the figures as it is too large. What I want is a grouped bar plot $\endgroup$ Commented May 10, 2020 at 12:19
  • $\begingroup$ Well one problem is that if you want a grouped barplot, the x-axis needs to be buckets and not continuous numbers, so you have to be fine with grouping the x-axis into certain chunks $\endgroup$
    – A Kareem
    Commented May 10, 2020 at 12:28
  • $\begingroup$ So if you can help me in this regard it will be much appreciated $\endgroup$ Commented May 10, 2020 at 12:34

1 Answer 1

0
$\begingroup$

I would first decide to bin the x-axis such that it can be plotted in groups. Thus if we want to for example group them into bins of width 5 then plot them next to each other we would do something like this

width_box = 5
low = -40
high = 40
width_graph = 1.5 # should be at most width_box/2 to not overlap

def sum_in_range(df, min_, max_):
    return df[(df['IC12']<max_) & (df['IC12']>=min_)].FRQ.sum()

indices = np.array(range(low, high, width_box))
sum1 = [sum_in_range(df, i, i+width_box) for i in indices]
sum2 = [sum_in_range(df_1, i, i+width_box) for i in indices]

fig = plt.figure()
ax = fig.add_subplot(111)
ax.bar(indices,sum1,width_graph,color='b',label='-Ymin')
ax.bar(indices+width_graph,sum2,width_graph,color='r',label='Ymax')
ax.set_xlabel('Test histogram')
plt.show()

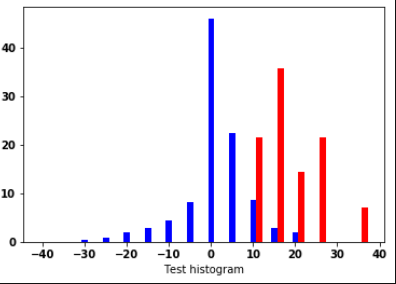
Which gives us

histogram

You can play around with the width_graph parameter to change how wide the bars look, and you can change width_box to group up the x-axis in different ranges

$\endgroup$
2
  • $\begingroup$ Thanks a lot, this is how I wanted my graph to be. Appreciate your help $\endgroup$ Commented May 10, 2020 at 13:23
  • $\begingroup$ Hi @DebashisPaul if this or any answer has solved your question please consider accepting it by clicking the check-mark. This indicates to the wider community that you've found a solution and gives some reputation to both the answerer and yourself. There is no obligation to do this. $\endgroup$
    – A Kareem
    Commented May 10, 2020 at 13:25

Your Answer

By clicking “Post Your Answer”, you agree to our terms of service and acknowledge you have read our privacy policy.

Not the answer you're looking for? Browse other questions tagged or ask your own question.